$SHIB/USD 4-hour analysis: Recent developments
The Shiba Inu price analysis revealed a bullish market trend as volatility slightly increases as the market opens, forcing the resistance and the support to move further away. However, this movement implies more vulnerability to volatile changes as prices move toward either extreme. Consequently, the upper limit of the Bollinger’s band sits at $0.00002483, which acts as the strongest resistance for $SHIB. Conversely, the lower limit of the Bollinger’s band is at $0.00002242, which acts as the strongest support for $SHIB.
The $SHIB/USD price appears to be crossing over the Moving Average curve, making the market bullish. Moreover, the price seems to move upward, indicating an escalating market. Finally, the price appears to move towards stability.
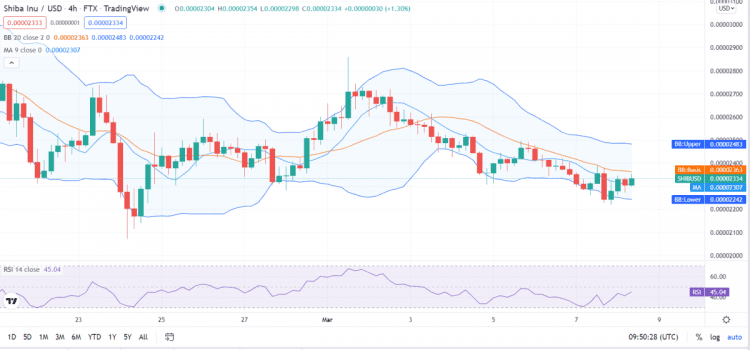
$SHIB/USD 4-hour price chart source: TradingView
The Shiba Inu price analysis reveals that the Relative Strength Index (RSI) score is 45, making $SHIB/USD fall in the lower neutral region. However, the price follows an increasing trend indicating a growing market and the dominance of buying activity, causing the RSI score to increase significantly.
Shiba Inu price analysis for 1-day: Market squeezes
The Shiba Inu price analysis indicates a bearish market. Moreover, the market’s volatility appears to follow a declining trend, making Shiba Inu’s price less vulnerable to volatility fluctuations. As a result, the upper limit of the Bollinger’s band is at $0.00002822, which serves as the strongest resistance for $SHIB. Conversely, the lower limit of the Bollinger’s band exists at $0.00002194, which acts as the strongest support for $SHIB.
The $SHIB/USD price appears to cross under the curve of the Moving Average, signifying a bearish movement. On the other hand, the price seems to be following a downward activity, showing signs of a decreasing market.
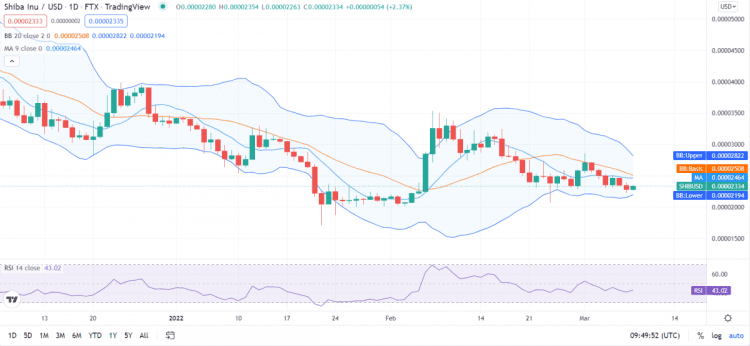
$SHIB/USD 1-day price chart source: TradingView
The Shiba Inu price analysis reveals the Relative Strength Index (RSI) score of 43, signifying a stable cryptocurrency. Furthermore, the RSI falls in the lower neutral region. Therefore, following an upward approach signals an increasing market and represents the buying activity exceeding the selling activity, causing the RSI score to increase.
Shiba Inu Price Analysis Conclusion
The Shiba Inu price analysis reveals the market following a bearish movement, showing further bullish possibilities as the market marches show increasing characteristics. The bears currently dominate the market but will likely be taken out by the bulls as they offer good dynamics.
Disclaimer. The information provided is not trading advice. Cryptopolitan.com holds no liability for any investments made based on the information provided on this page. We strongly recommend independent research and/or consultation with a qualified professional before making any investment decisions.

 cryptopolitan.com