Past Performance of $HNT
$HNT prices fell from the rejection faced near the confluence of the resistance trendline and $25. The downfall breaks below $22 to find support at the descending trendline of the falling wedge pattern. The demand reverses the price action resulting in a 5% growth last 48 hours with a potential morning star pattern. 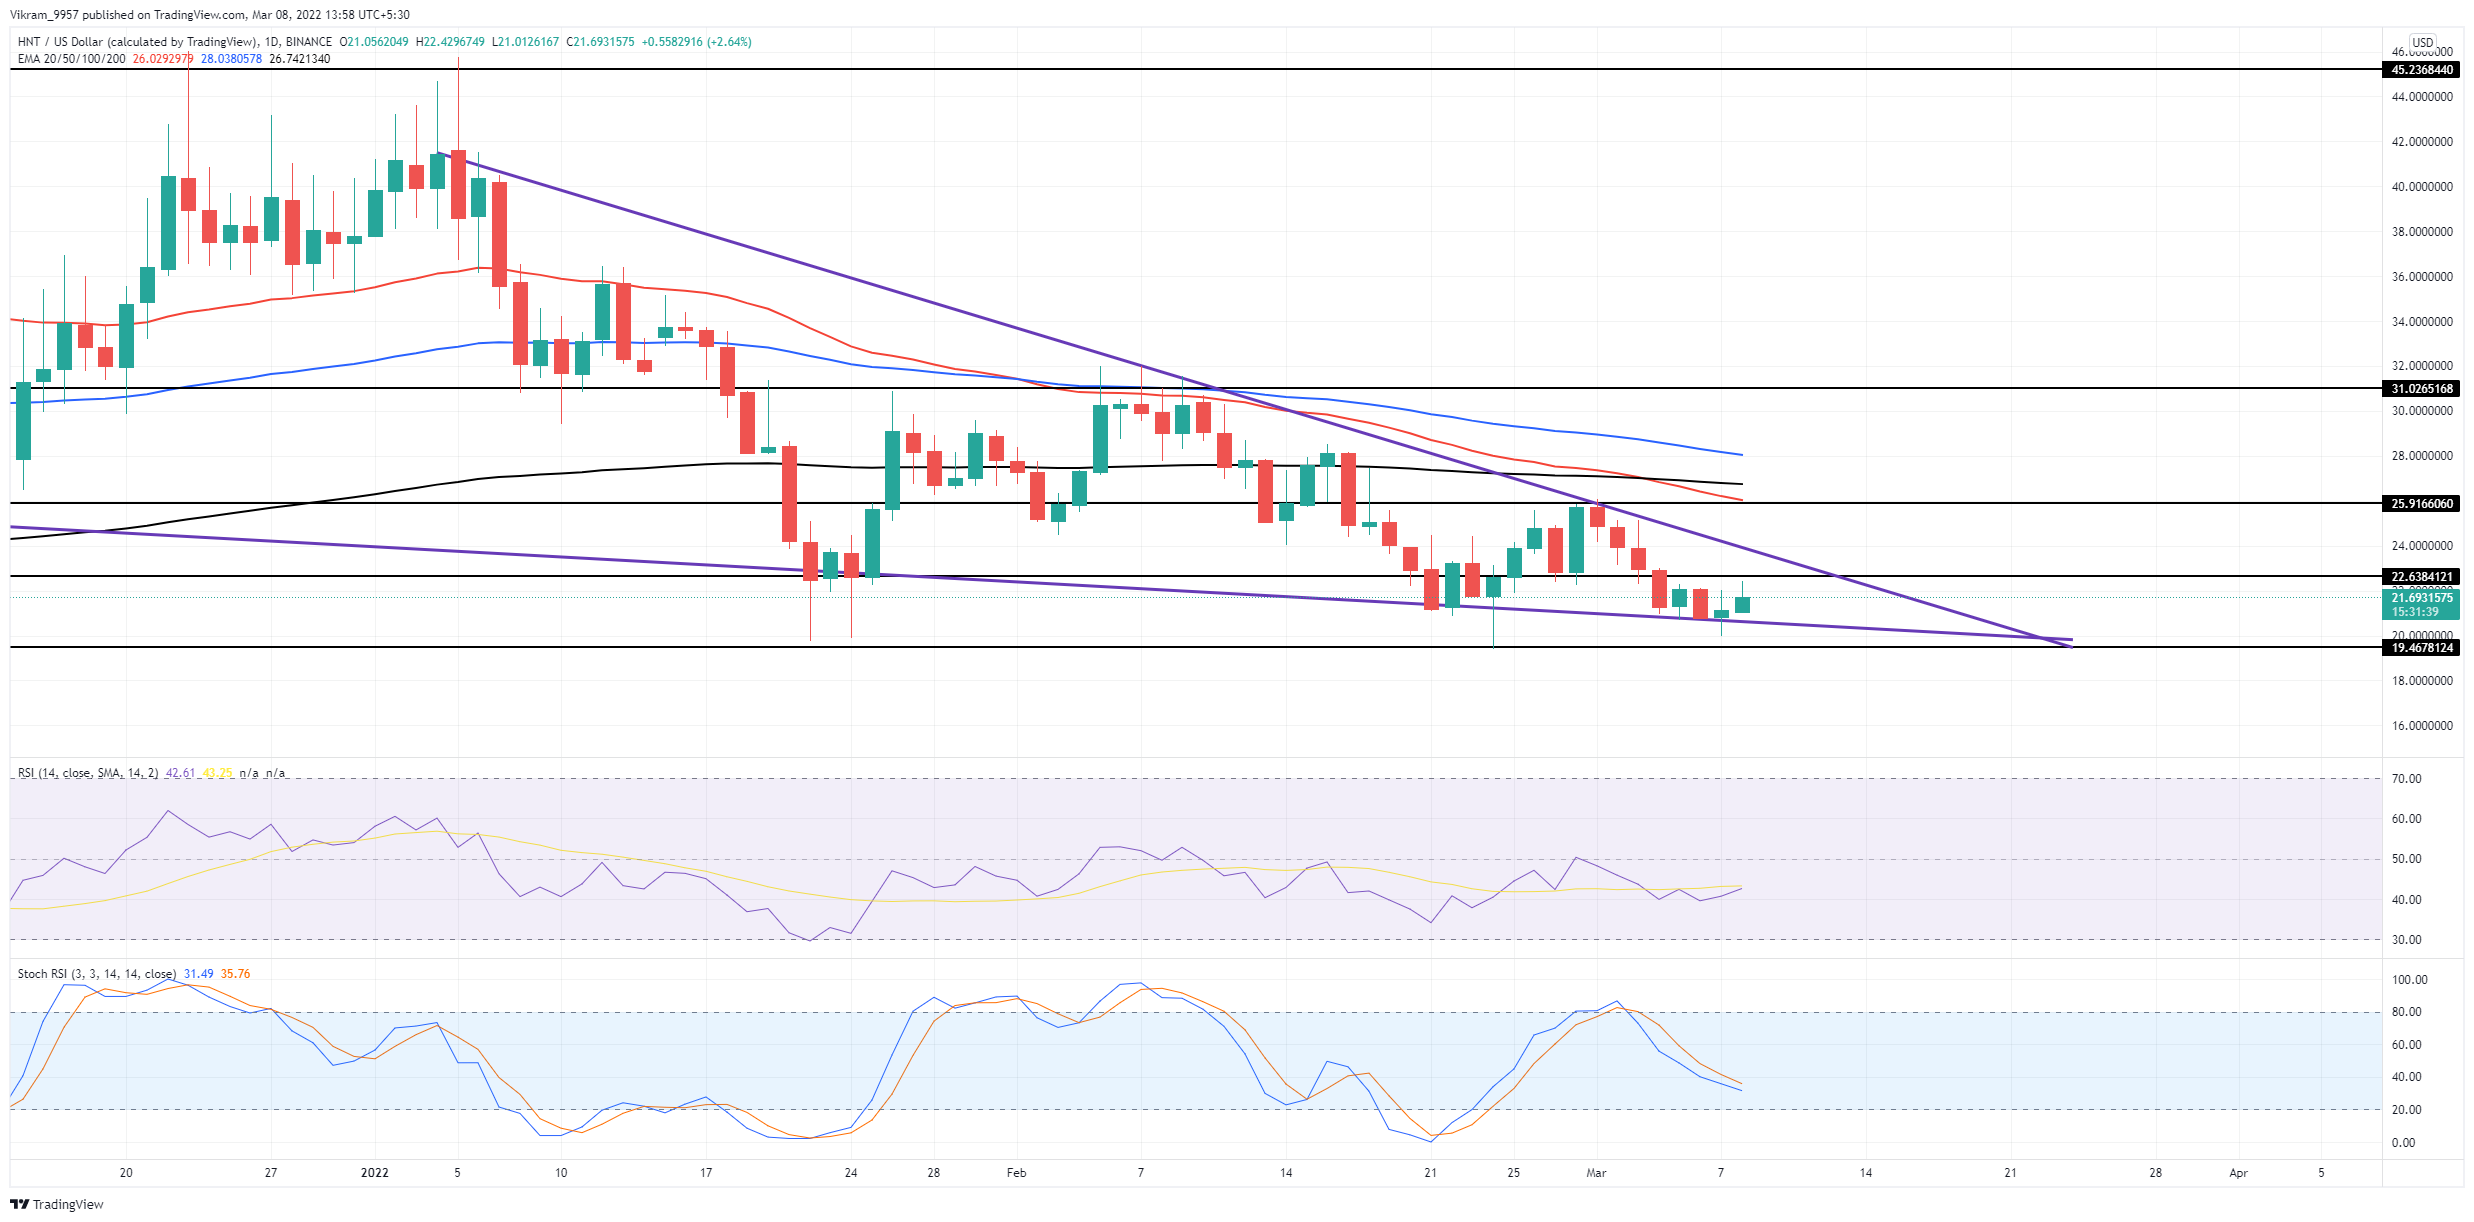 Source-Tradingview
$HNT Technical Analysis
The $HNT price may shortly reach the resistance trendline of the falling wedge pattern that will account for an extra 6% rise. However, the breakout potential increases as the bearish pattern bottle up. The crucial EMAs keep a falling trend that has resulted in the recent death cross and the rise in bearish attention. Moreover, the falling 100-day EMA might shortly give a negative crossover with the 200-day EMA to achieve a bearish alignment. RSI Indicator: The RSI slope gradually rises from the nearly oversold zone after days of consolidation below the 50% mark. Moreover, the RSI slope shows a bullish divergence in the last two dips at the descending trendline. Stochastic RSI Indicator: The K and D lines come closer within the neutral territory as the bulls take control near the support trendline. Hence, the chances of a bullish crossover are increasing significantly. In a nutshell, $HNT technical analysis shows a bullish bias as the prices show reversal within the falling wedge pattern.
Upcoming Trend
$HNT coin price action can reach the 50-day EMA at $25 after the bullish breakout of the falling wedge pattern. However, a reversal from the resistance trendline will result in further resonance. Contrarily, the breakout of the descending support trendline, the downfall can reach the $18 to $16 depending upon the selling intensity. Support Levels: $18 and $16 Resistance Levels: $22 and $25

 cryptoknowmics.com