Past Performance of $THETA
$THETA prices continue to create lower high formation under the bearish influence of the 50-day EMA and the long-coming resistance trendline. The altcoin retraces to $2.5 and forms a morning star pattern that hints of a bullish reversal to the 50-day EMA. Moreover, the sudden overnight recovery of the crypto market increases the chances of a turnaround. 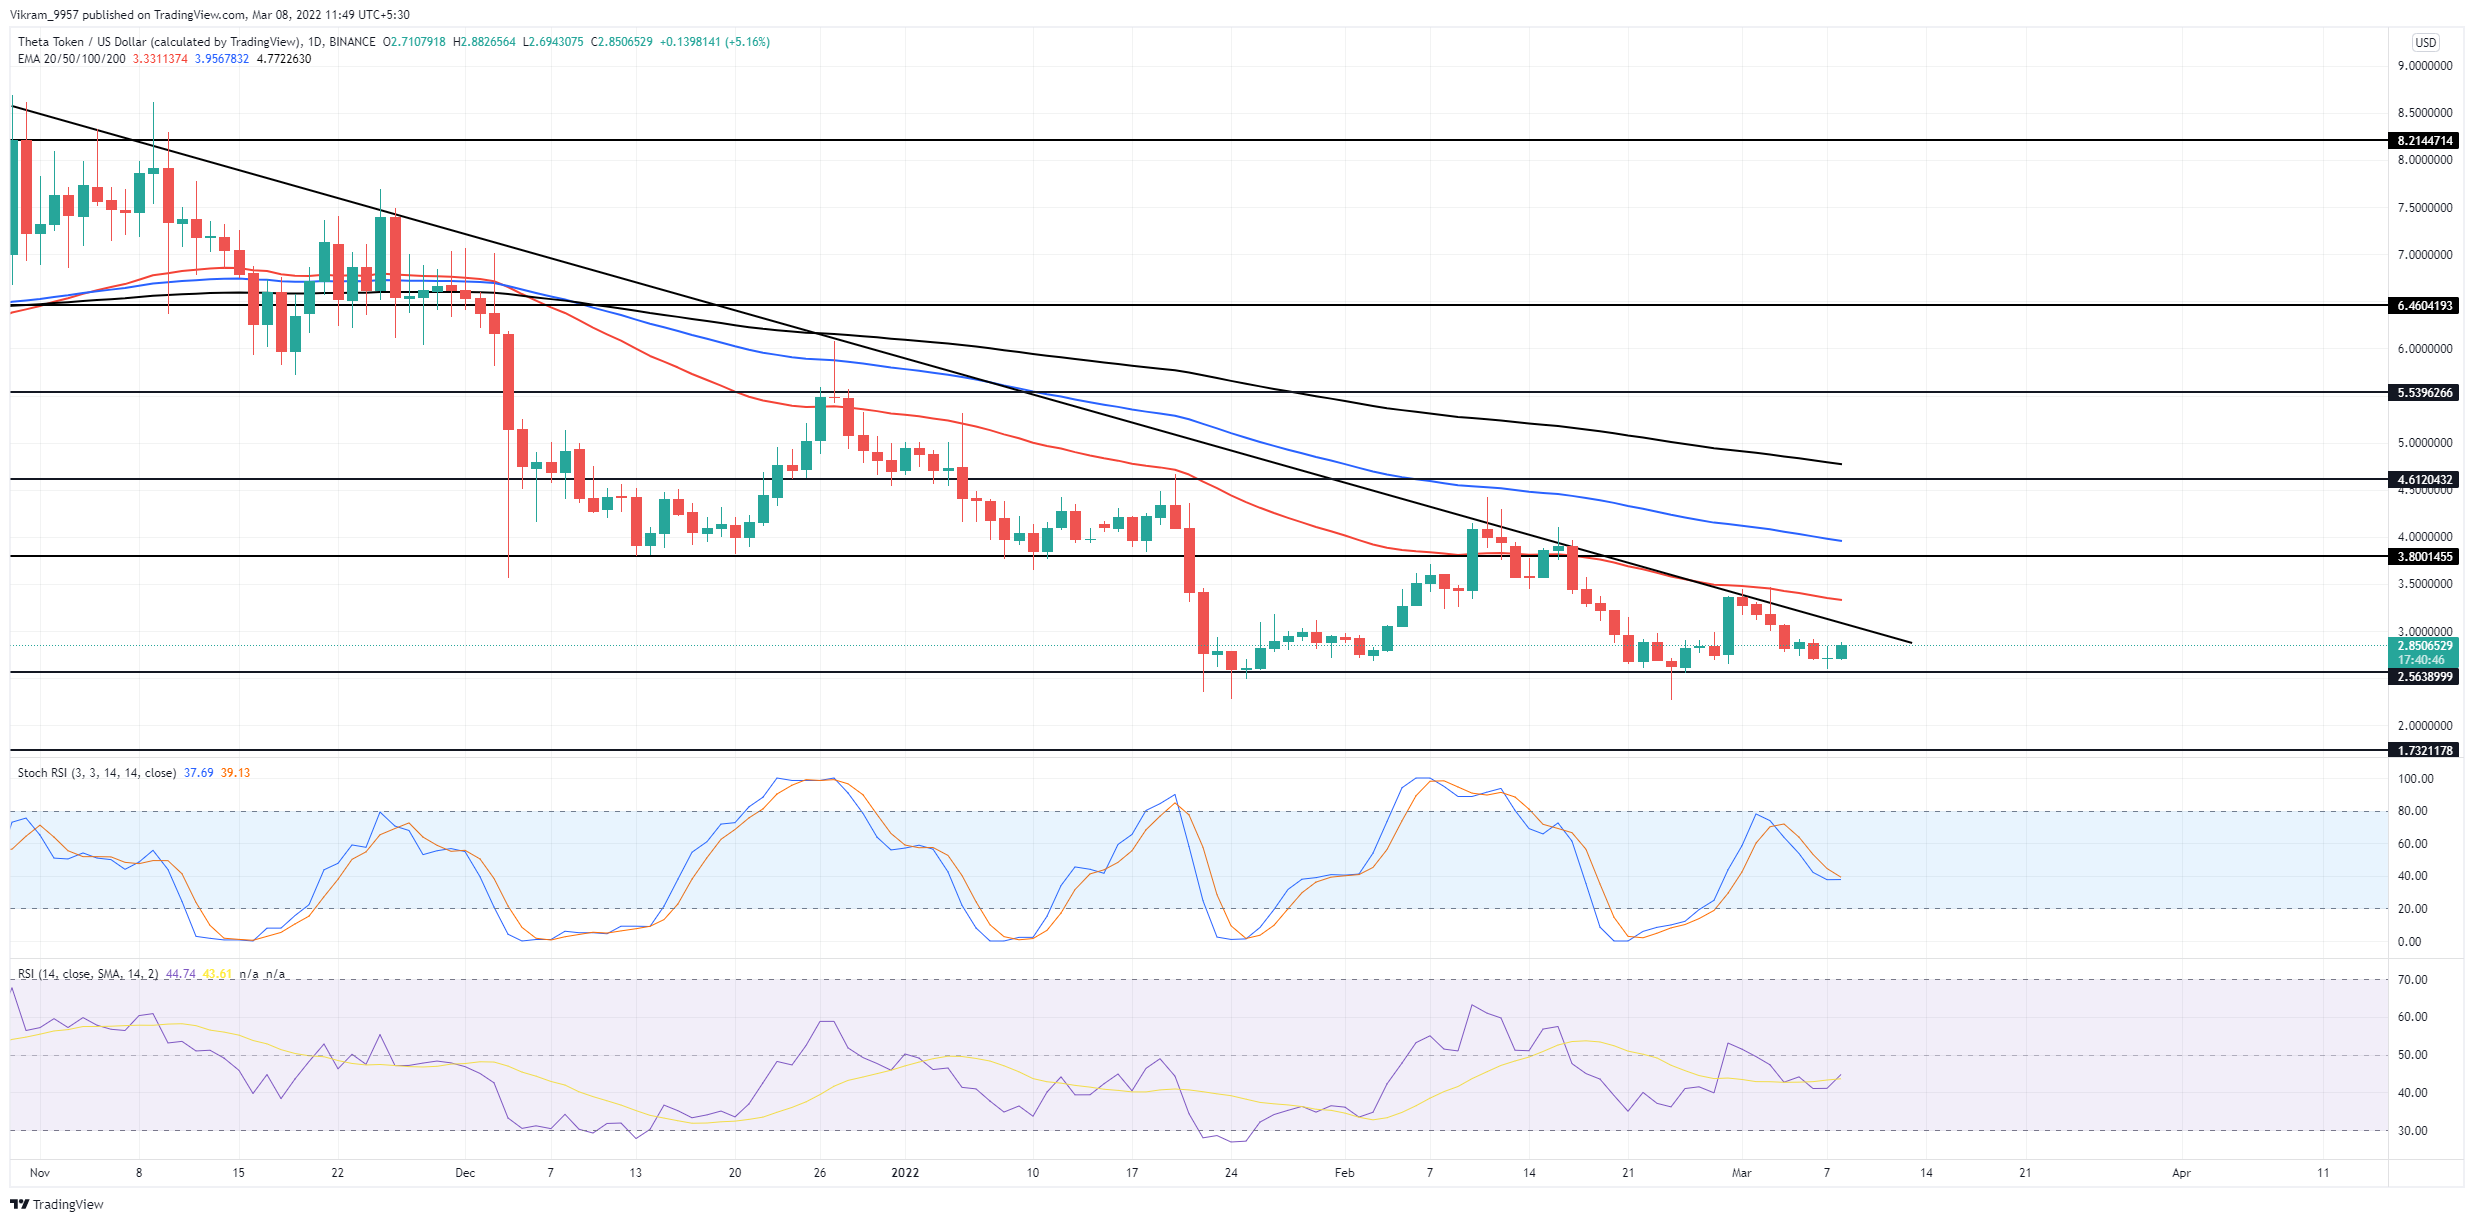 Source-Tradingview
$THETA Technical Analysis
$THETA prices show a growth of 5.38%, with the demand met near the $2.5 mark, reflecting a bullish revolt after the 20% fall last week. Hence, buyers can expect the reversal to reach the $3 mark at the current price. The crucial EMAs maintain a bearish alignment as the altcoin continues under the highly influential resistance trendline. Moreover, the dynamic resistance provided by the 50-day EMA keeps the bullish growth in check. RSI Indicator: The RSI slope shows a reversal from the 14-day average after tanking below the 50% line. Moreover, the RSI slope projects a bullish divergence in the last two dips at the $2.5 mark. Hence, the chances of reversal giving a trendline breakout increase. Stochastic RSI Indicator: The K and D lines show an early reversal in the neutral zone that may shortly result in a bullish crossover. Moreover, the divergence in the lines is crystal clear, increasing the chances of a trendline breakout. In a nutshell, $THETA technical analysis shows a high likelihood of a bullish breakout of the resistance trendline and the 50-day EMA.
Upcoming Trend
$THETA coin price action may shortly show a bullish rally following the morning star pattern and break above the 50-day EMA. The breakout has the potential to reach the 200-day EMA close to $5. However, closing below $2.5 will nullify the bullish theory and tank the prices to $2. Support Levels: $2.5 and $2 Resistance Levels: $3.5 and $5

 cryptoknowmics.com