Past Performance of $WAVES
$WAVES prices show an overnight growth of 26% resulting in the breakout of $20 and creating a bullish engulfing candlestick in the daily chart. The engulfing candle undermines the previous higher price rejection candlesticks and the sellers at $20. The altcoin shows a bullish continuation at press time and breaks above $23. 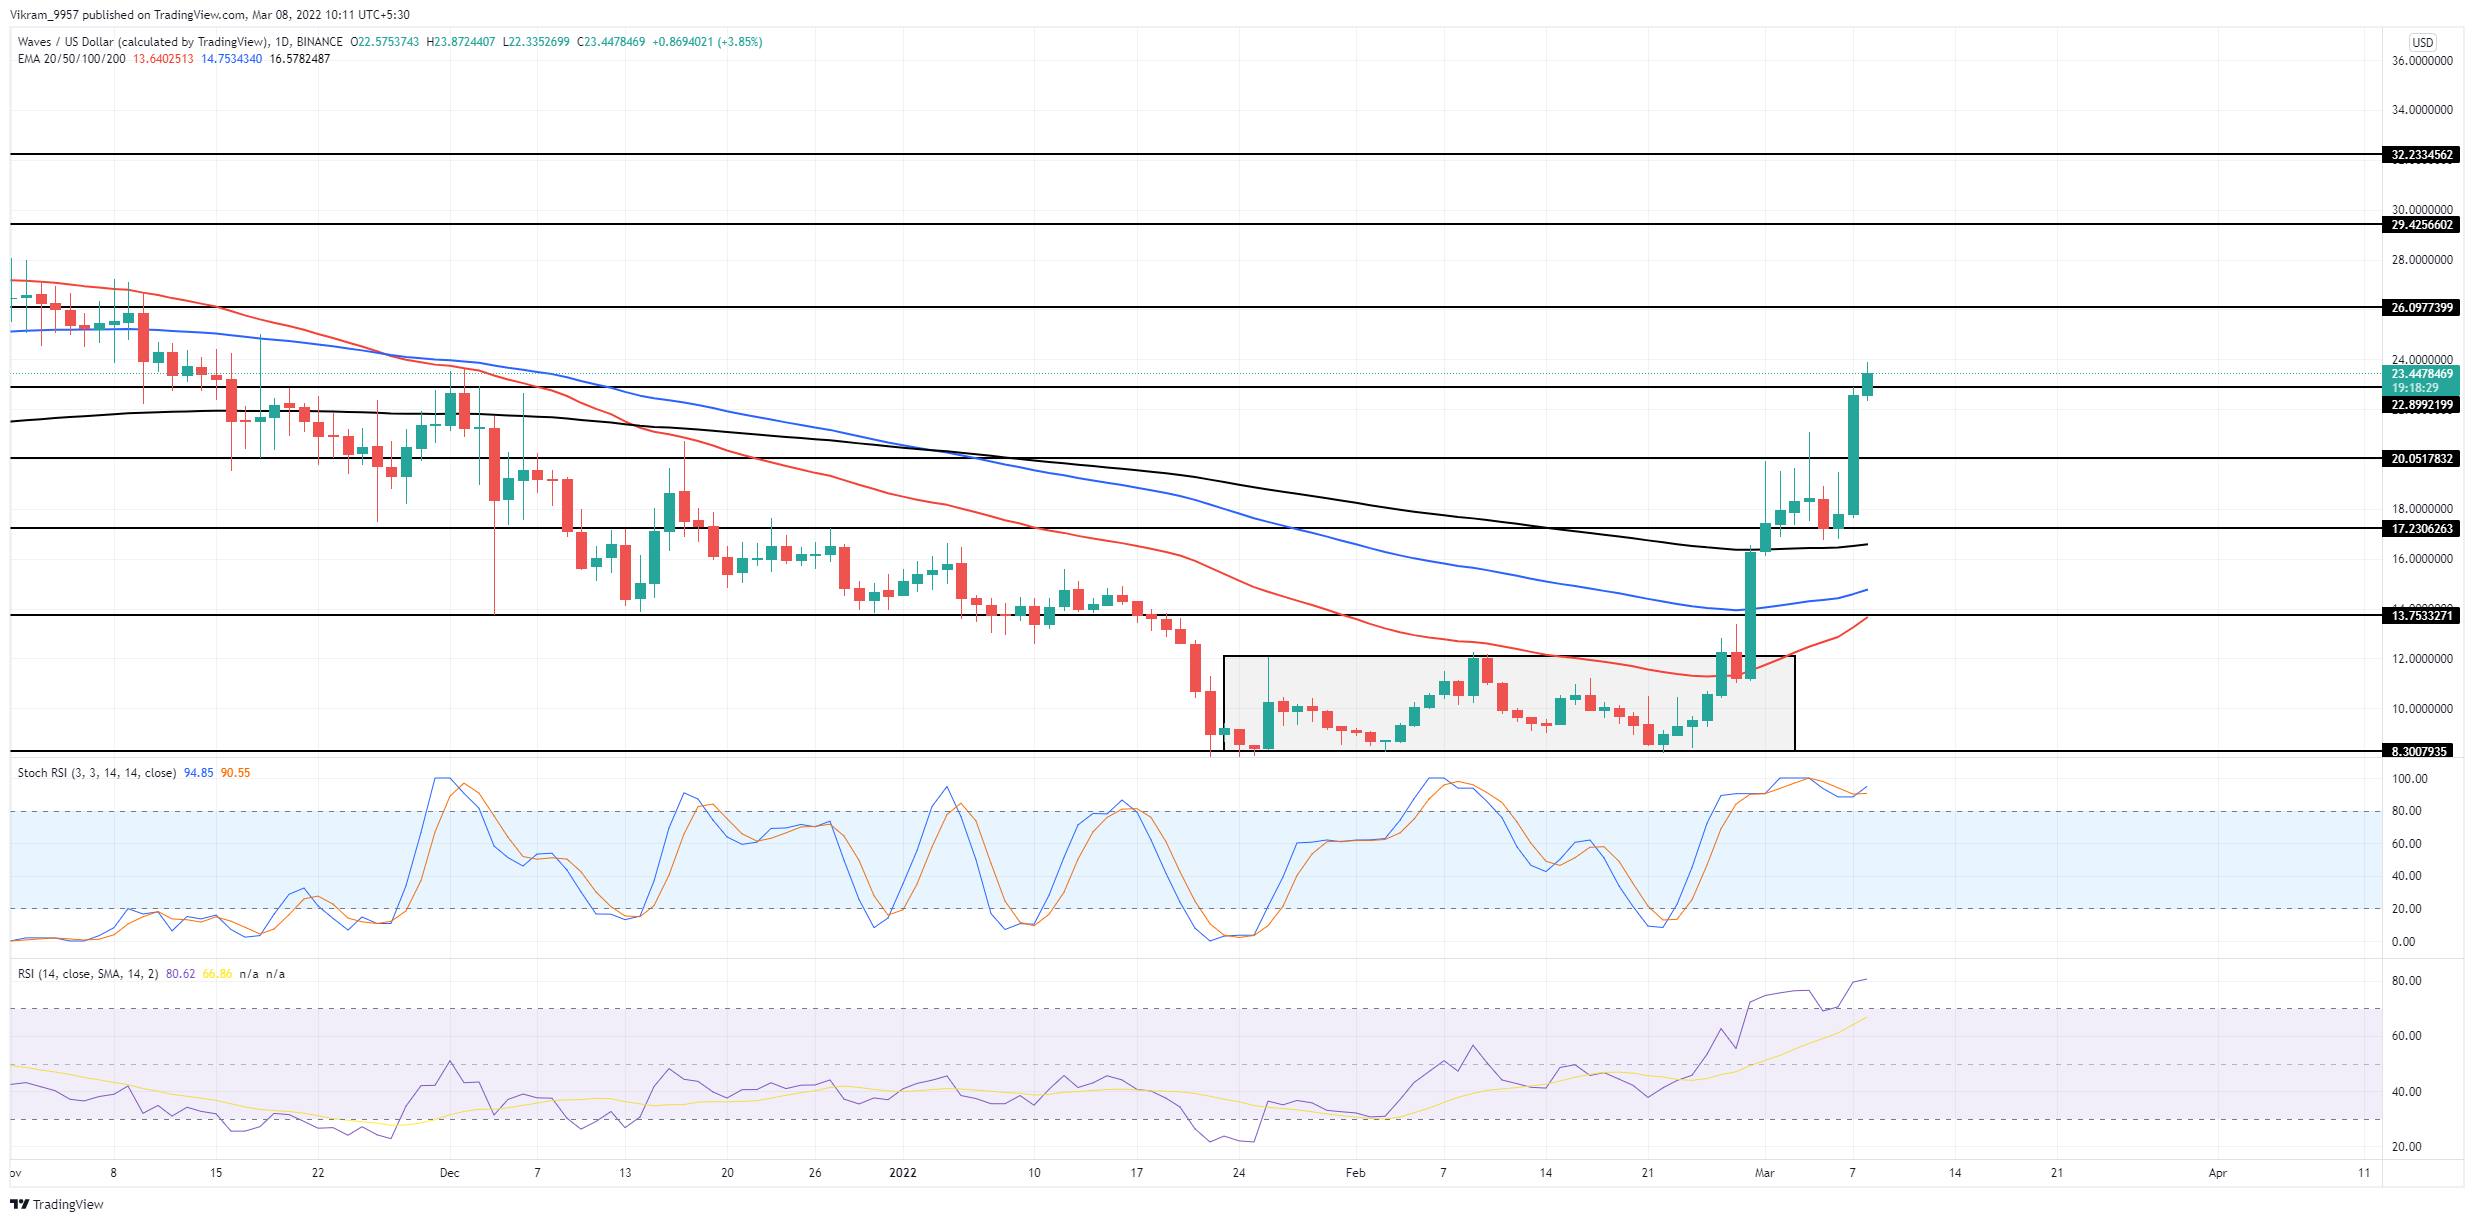 Source-Tradingview
$WAVES Technical Analysis
$WAVES prices show an uptrend continuation with the recent bullish rally after the $17 and 200-day EMA retest. Hence, the upcoming rally might shortly approach $25 as buying pressure increases, evidenced by the growth in trading volume. The 50 and 100-day EMAs take a sharp reversal and might shortly give a bullish crossover in the daily chart. Moreover, the rally continues after a 200-day EMA retest. Therefore, the EMAs can continue to provide emotional support to the rising prices. RSI Indicator: The RSI slope persists in the overbought territory and surpasses the 80% mark with the ongoing uptrend. However, the rising trend might show a short-term retracement to unsaturate the overbought nature. Stochastic RSI Indicator: The K and D lines move sideways as they give a sharp reversal with a bullish crossover. In a nutshell, $WAVES technical analysis shows a high likelihood of a bullish continuation to the $25 mark.
Upcoming Trend
$WAVES coin price action showcases a rise in the buying pressure that may shortly surpass the $25 mark and continue the bullish rally. However, closing below the $20 mark will invalidate the bullish thesis and draw the price back to the 200-day EMA. Support Levels: $20 and $17 Resistance Levels: $25 and $30

 cryptoknowmics.com