There was a move below the $0.1880 and $0.1800 support levels. There was also a close below the $0.1800 level and the 55 simple moving average (4-hours). A low is formed near $0.1697 and the price is now consolidating losses.
An immediate resistance is near the $0.1770 level. It is near the 23.6% Fib retracement level of the downward move from the $0.2025 swing high to $0.1697 swing low.
There is also a crucial bearish trend line forming with resistance near $0.1750 on the 4-hours chart. The next key resistance is near the $0.1850 level and the 55 simple moving average (4-hours). It is close to the 50% Fib retracement level of the downward move from the $0.2025 swing high to $0.1697 swing low.
Any more gains could lead the price towards the $0.2000 level. A close above $0.2000 could open the doors for a decent increase.
An immediate support on the downside is near the $0.1680 level. The next major support is near the $0.1650 level. Any more losses could lead the price towards the $0.1500 level, where the bulls might take a stand. If they fail, the price may perhaps decline towards the $0.1350 support zone.
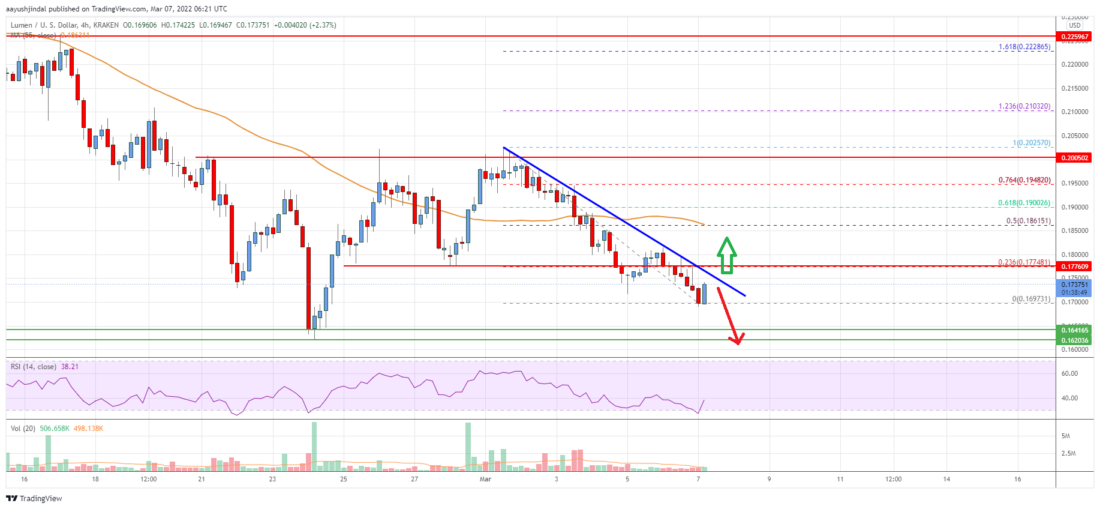
Stellar Lumen ($XLM) Price
The chart indicates that $XLM price is now trading below $0.1880 and the 55 simple moving average (4-hours). Overall, the price could continue to decline if there is a clear move below $0.1650 in the near term.
Technical Indicators
4 hours MACD – The MACD for $XLM/USD is slowly gaining momentum in the bearish zone.
4 hours RSI – The RSI for $XLM/USD is now below the 50 level.
Key Support Levels – $0.1680 and $0.1650.
Key Resistance Levels – $0.1750, $0.1850 and $0.2000.

 livebitcoinnews.com