Past Performance of $SAND
$SAND prices continue to trend lower under the highly influential bearish trendline, and the selling observed in the entire crypto market. The downtrend breaks the 200-day EMA and the psychological support of $3. Hence, the downtrend may shortly reach the $2.65 mark. 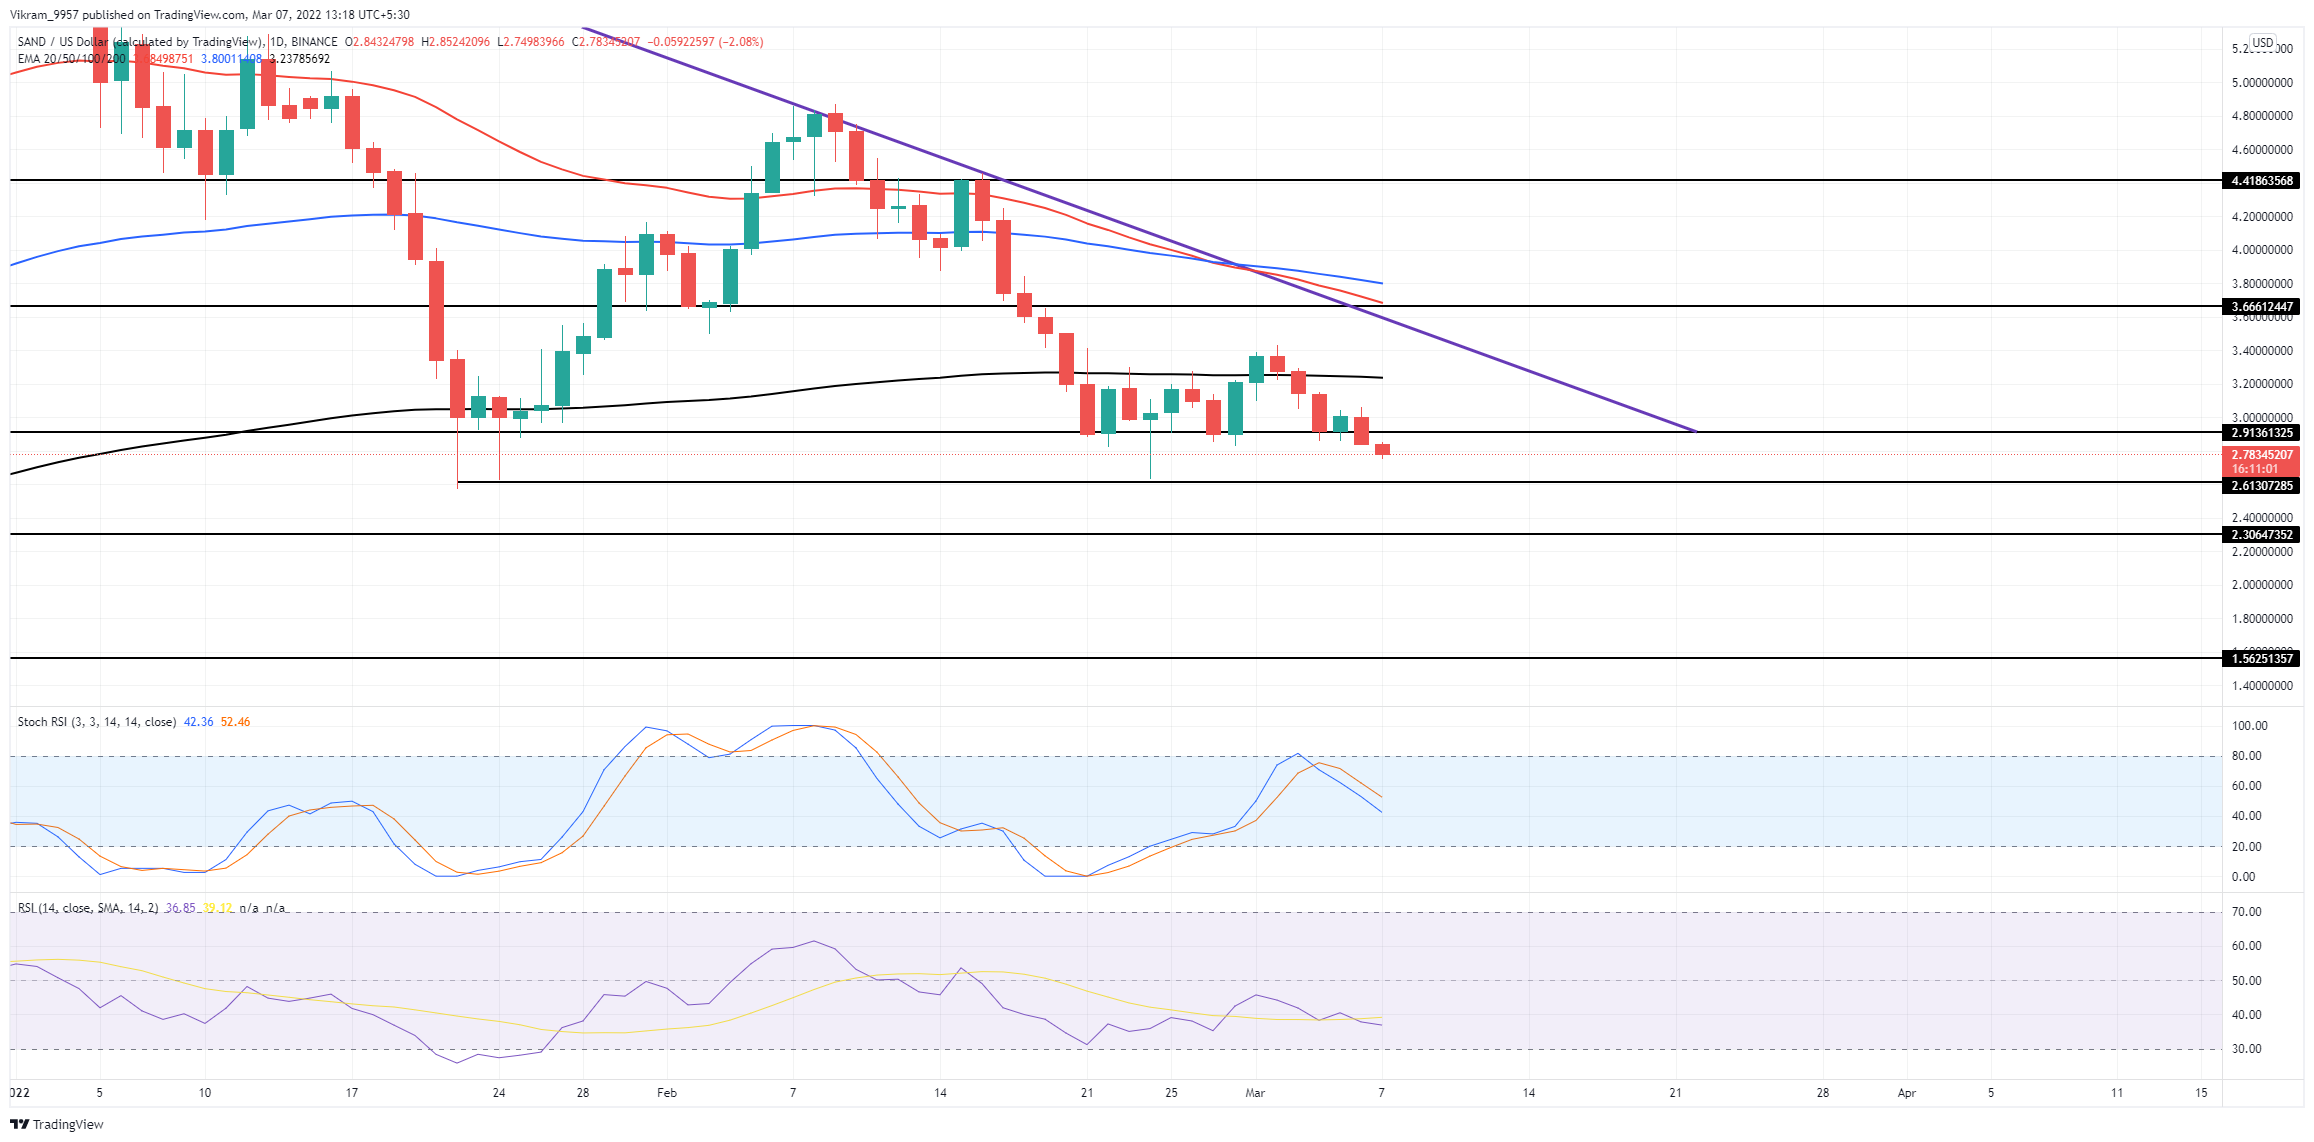 Source-Tradingview
$SAND Technical Analysis
$SAND prices fell by almost 20% last week after facing rejection from the confluence of 50 and 100-day EMAs. Hence, the altcoin may find support at the previous lower price rejection spot at $2.65. However, a tighter bearish grip over trend control will result in a downfall to $2.30. The 50 and 100-day EMAs maintain a negative trend after the bearish crossover. Hence, with the negative direction, the 50-day EMA might shortly result in a death cross. RSI Indicator: The RSI slope continues a negative trend after failing to rise above the 50% mark. Moreover, the RSI slope crosses below the 14-day average line indicating a rise in the selling pressure. Stochastic RSI Indicator: The K and D lines show a reversal from the overbought boundary resulting in a negative trend after a bearish crossover. Hence, the ongoing bear cycle reflects a rise in selling pressure. In a nutshell, $SAND technical analysis shows a high likelihood of a bearish continuation to the $2.30 mark.
Upcoming Trend
$SAND coin price action indicates a boom in the underlying bearishness with the psychological support level $3 fallout. Moreover, the lack of any critical support level makes the bullish reversal possibility significantly low. However, closing above the $3 mark will invalidate the bearish thesis and reverse the 200-day EMA. Support Levels: $2.30 and $2 Resistance Levels: $3 and $3.25

 cryptoknowmics.com




