Past Performance of $MANA
$MANA prices continue to be downtrend after retesting the triangle pattern breakout and breaking below the $2.5 mark. The altcoin prices fell by 5.59% in the last 24 hours resulting in the breakdown of the 200-day EMA. Hence, closing below the 200-day EMA will ensure a downfall to the $2 mark. 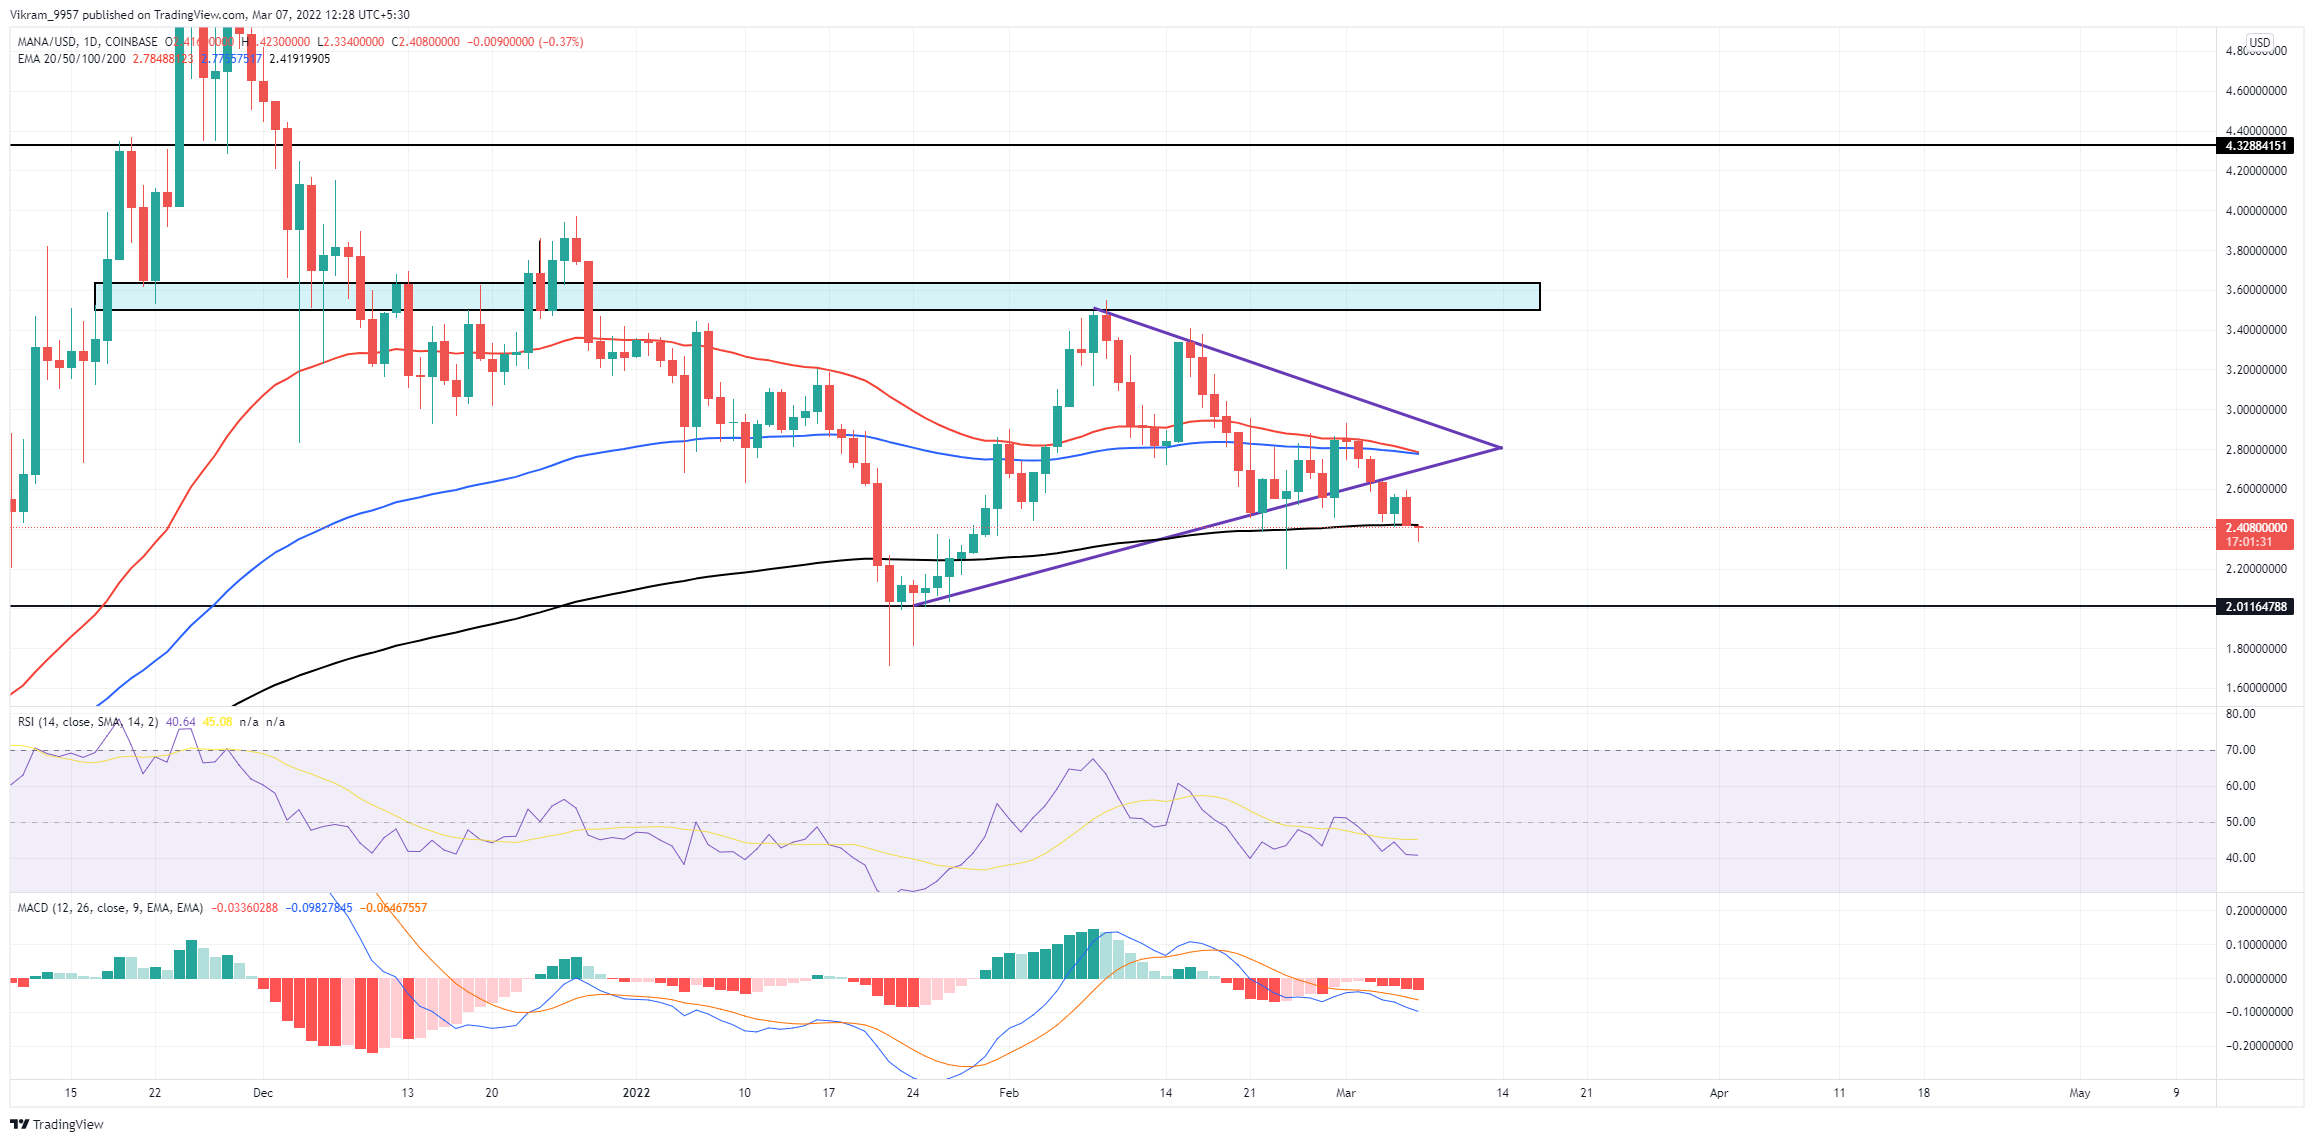 Source-Tradingview
$MANA Technical Analysis
$MANA prices fell by 15% last week, resulting in a rise in the selling pressure evident by the growth in trading volume. However, if the meta token sustains above the 200-day EMA, a reversal is plausible. The falling trend in the 50 and 100-day EMA results in a negative crossover and may shortly achieve a bearish alignment. Moreover, the 200-day EMA fallout marks the increasing number of sellers. RSI Indicator: The RSI slope continues the sideways movement with a bearish influence as it fails to rise above the 50% mark and falls below the 14-day SMA. The lack of divergence decreases the chances of a bullish reversal from the 200-day EMA. MACD Indicator: The falling trend of the fast and slow lines after avoiding a bullish crossover slightly below the zero line reflects the substantial bearish influence. Hence, the indicator projects the possibility of a downfall to the $2 mark. In a nutshell, $MANA technical analysis shows a highly influential bearish trend is starting to shape.
Upcoming Trend
$MANA coin price may shortly continue the downtrend below the 200-day EMA as bearish anticipation rises. However, a daily candle closing below the EMA will provide an extra edge to sellers. However, a bullish reversal from the EMA will invalidate the bearish thesis and result in a retracement to the $3 mark. Support Levels: $2.20 and $2 Resistance Levels: $2.55 and $2.80

 cryptoknowmics.com