
 finbold.com

Barely one day into the month, and September is already shaping up to be quite interesting for $XRP.
Most notably, prediction markets now see an 87% chance of a U.S. $XRP exchange-traded fund (ETF) launching in 2025, according to data from Polymarket, while Bloomberg projects $5–8 billion in potential inflows should approval arrive by October 2025.
Whales have also bought 340 million $XRP, worth around $900 million, over just two weeks in August, marking the biggest whale spree since mid-2024. Exchange inflows also remain high at 260 million $XRP per week.
Ripple’s legal victory against the U.S. Securities and Exchange Commission (SEC) in August likewise lifted restrictions on institutional $XRP sales, paving the way for expanded partnerships with banks such as SBI Holdings.
$XRP price prediction
To set an $XRP price target for September 30, 2025, Finbold’s AI prediction agent used multiple LLMs to generate an average forecast for improved accuracy while incorporating momentum-based indicators into its context. You can experiment with the existing prompts or create your own.
According to our prediction agent, the average $XRP price on September 30 will be $2.70, implying a 3.23% downside from the current price of $2.79.
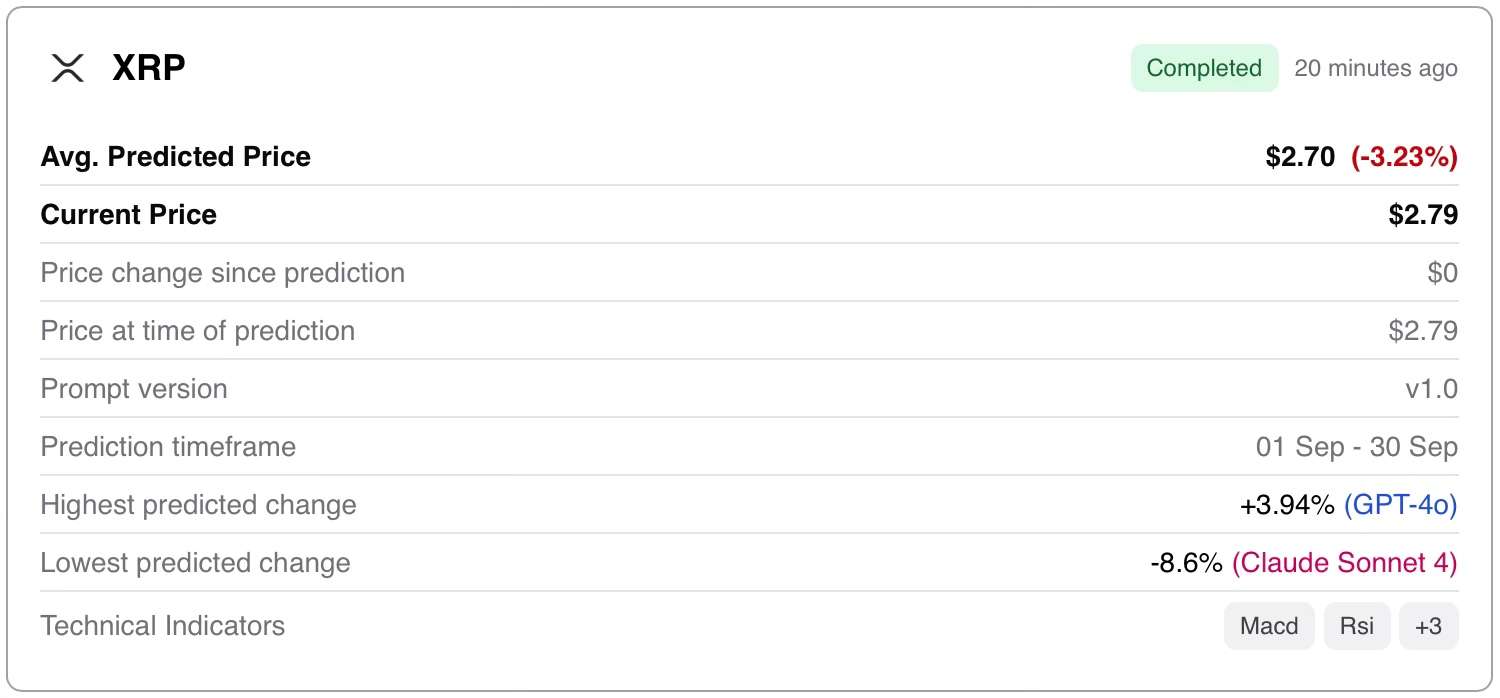
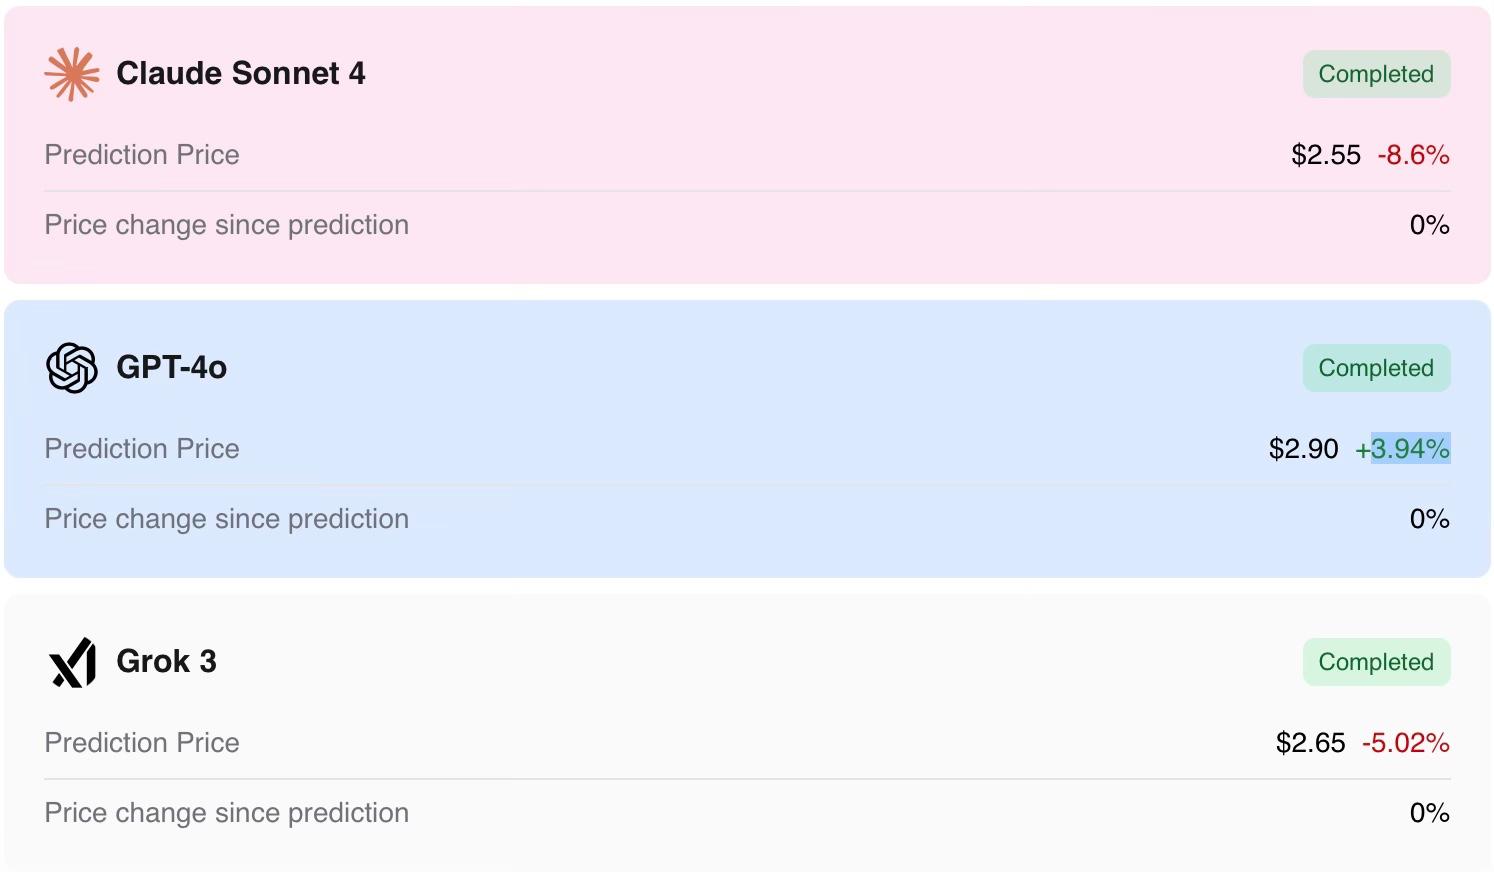
Anthropic’s Claude 4 Sonnet posted the most pessimistic forecast, projecting an $XRP price of at $2.55, a potential 8.6% downside from the current price.
Grok 3 was also bearish with a target of $2.65, a 5.02% downside. GPT-4o, however, was bullish, predicting the cryptocurrency would trade at $2.90 by the end of the month and projecting a 3.94% upside.
On the technical side, $XRP is showing signs of short-term weakness reflected in its weekly 5.5% drop as of the time of writing.
With the current price of $2.79, the cryptocurrency is trading well below its 50-day moving average (MA) of $3.09, highlighting continued short-term bearish pressure.
Momentum indicators further reinforce the downtrend, as the moving average/convergence divergence (MACD) sits at -0.062, below its signal line at -0.035 and with a negative histogram of -0.027. However, slopes suggest the decline may be stabilizing, as the chart below indicates.
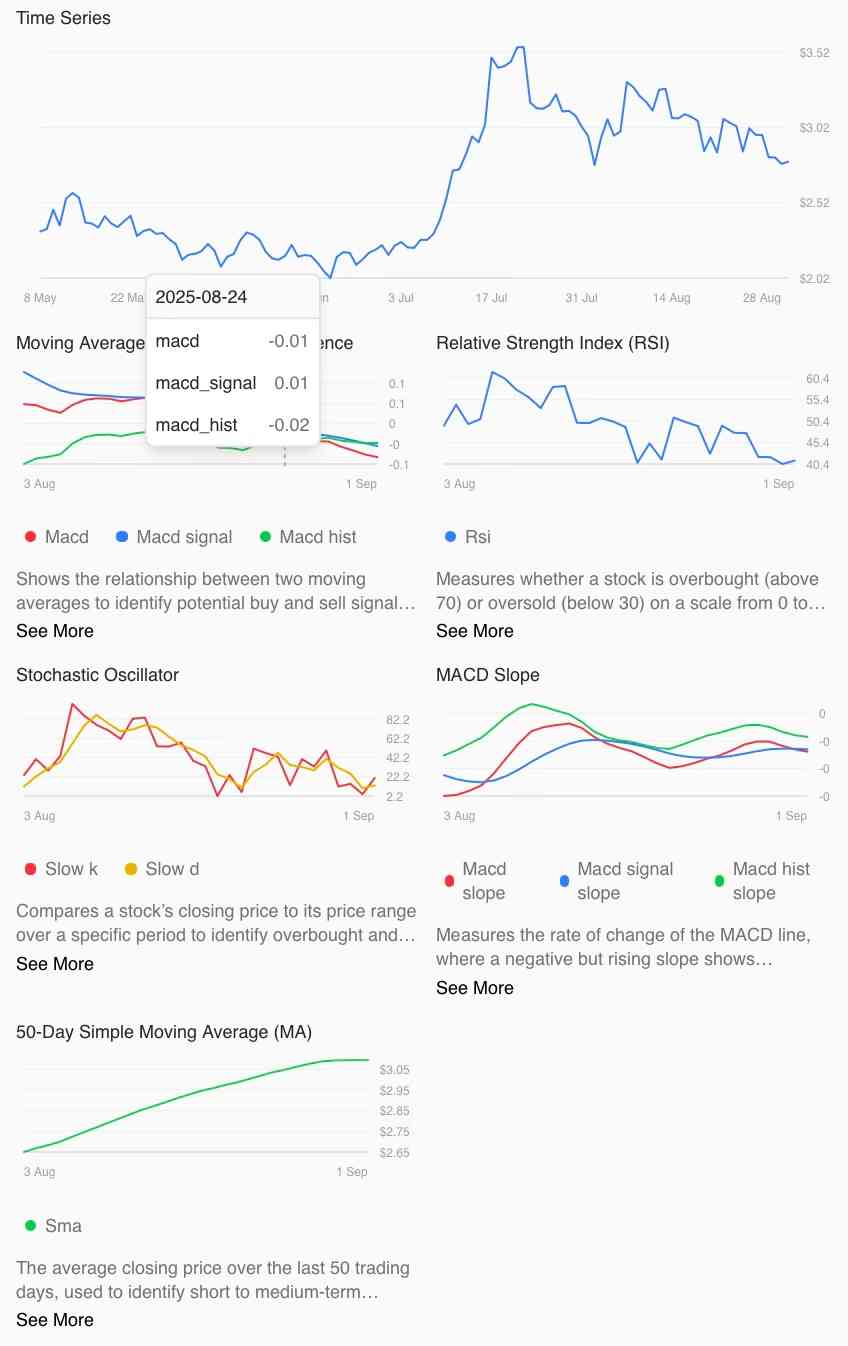
The relative strength index (RSI) reads 41.27, indicating neutral-to-bearish conditions, while the stochastic oscillator shows %K at 20.71 and %D at 13.19, approaching oversold territory. This could signal that $XRP is nearing a short-term bottom and may be primed for a bounce if buying pressure emerges.
Maintaining above $2.76 will be crucial to prevent further downside. If the support holds, $XRP may rebound toward the mid-range resistance around $3.20. A sustained breakout above that could further pave the way toward the $3.60.
Featured image via Shutterstock