
 u.today

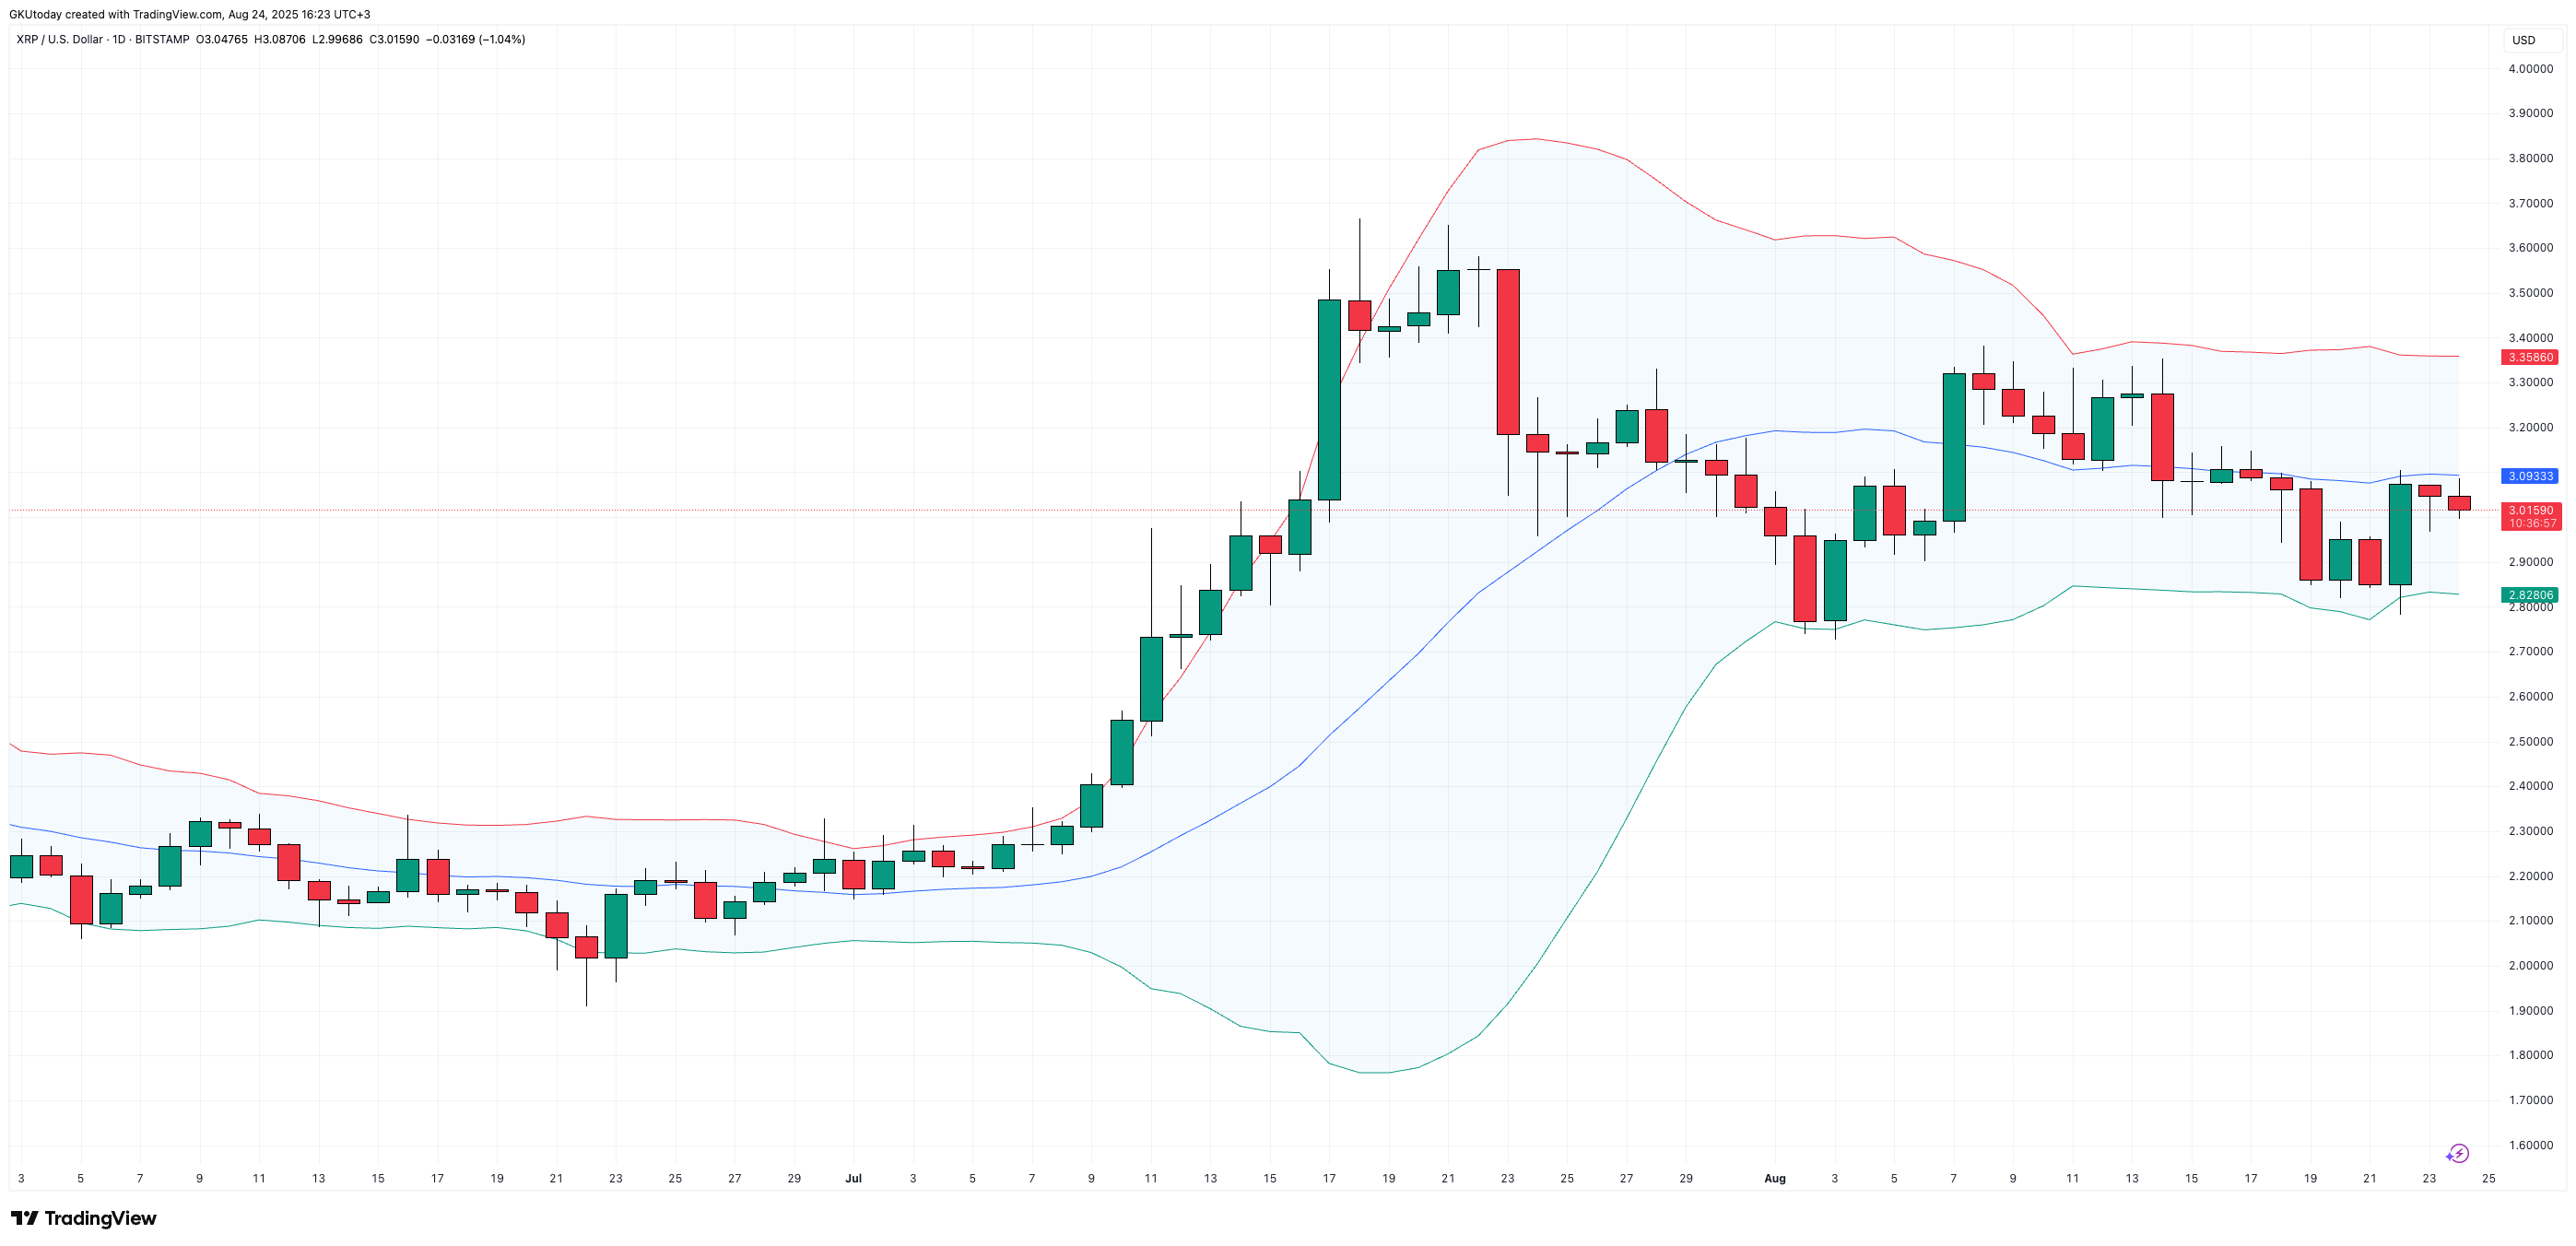
$XRP's bounce back up to $3 is grabbing people's attention, but the technical analysis doesn't paint a full-on bull picture. If you look at the daily chart, you'll see that $3 lines up pretty closely with the Bollinger Bands' middle line.
So far, the price has not been able to break through it. That rejection makes the return to $3 less of a breakthrough and more of a stopping point, keeping the bias tilted bearish despite the rebound.
Over the past few weeks, $XRP's price has been fluctuating around this range, and each time it reaches $3, it hits a wall instead of moving forward.
The midline, which is now at around $3.09, has become the pivot point that determines whether the asset can recover and become bullish again or if it will stay capped under pressure. So far, $XRP has not been able to close above that line on a daily chart.
The wider setup basically makes the same point. On the weekly chart, $XRP's rally earlier this summer stretched the bands to their widest in years, but the retracement has brought it right back into the middle zone. The mid-band here is around $2.61, so the recent moves are basically a struggle to hold the upper half of the range.
If $3 keeps failing, the path toward the lower side — $2.60 and possibly even deeper into the $2.00 area — remains open.
"It's trap"
That's why $3 print jobs should be handled with care. It's a pretty powerful number, psychologically speaking, but the reality on the ground is that there's still a lot of resistance compared to support.
If there is a real change in the structure, $XRP's price would have to break and stay above the $3.35 upper band, which would open up room for growth. Until that happens, the Bollinger framework shows that $3 is not a victory, it's a trap. The sentiment may look better than the actual chart dynamics allow.