At the time of writing, the metric hovered around $1.17 billion.
Meanwhile, $OKB is one of the standout performers in the past 24 hours and week, outpacing top altcoins as recent bullish catalysts keep bulls in control.
BNB also hit a new peak as exchange tokens rally.
Why $OKB surged 50% as it hit a new all-time high
As top altcoins braced for a fresh dose of downside volatility, $OKB extended its recent rally to a new $ATH.
Having gone vertical from lows of $46 to highs of $116 on Aug. 13, the token retested the $92 area.
But bulls have traded higher since, breaking above $150 and hitting the intraday record high of $195 on Aug. 21.
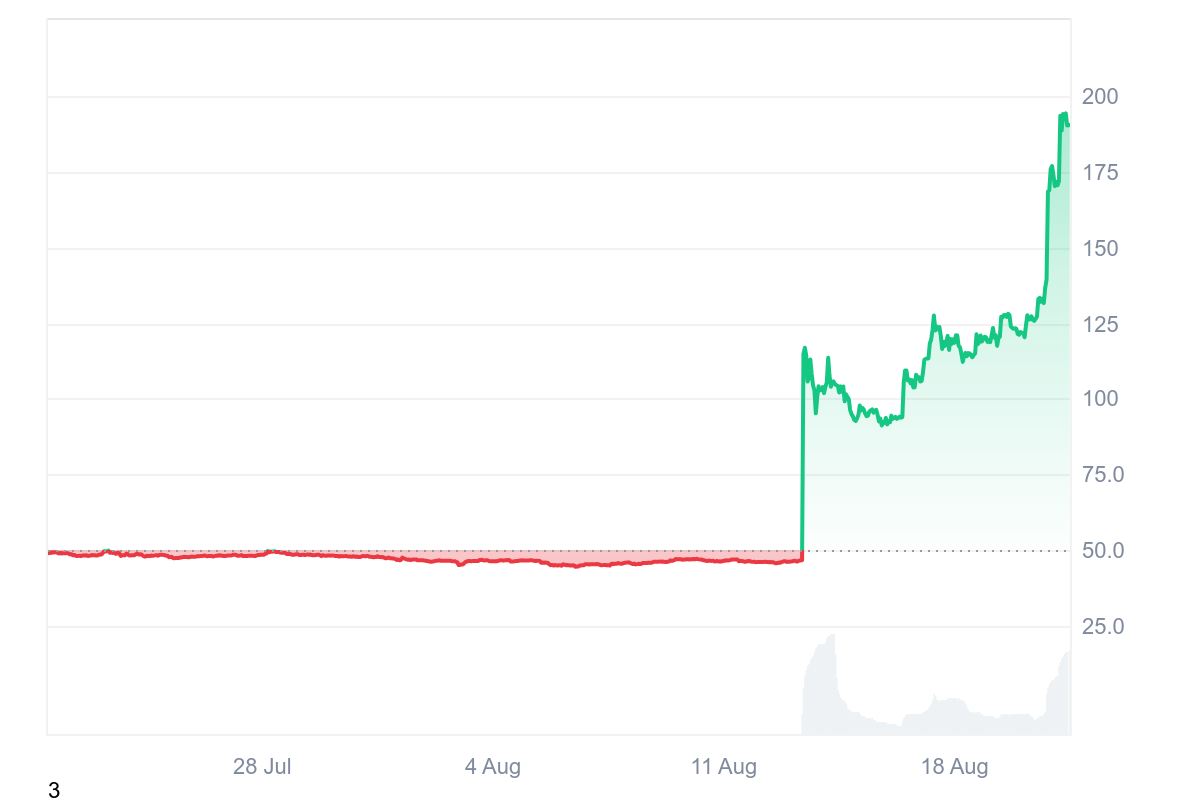
$OKB chart by CoinMarketCap
The buying pressure follows a strategic tokenomics overhaul that OKX undertook recently, with this significantly altering the $OKB’s supply dynamics.
On Aug. 13, OKX executed a massive one-time burn of 65.26 million $OKB tokens, slashing the circulating supply by over 50% to a fixed cap of 21 million tokens.
The move meant OKX aligned its token’s supply with Bitcoin’s hard cap, with the deflationary event a key catalyst to the parabolic price action.
The supply change has seen $OKB’s market cap surge to $4 billion, while the price has increased nearly 90% in the past week and over 290% in the past 30 days.
As well as the token burn, OKX introduced an upgrade to its zero-knowledge Ethereum Virtual Machine (zkEVM) network built with Polygon technology.
The upgrade boosted the network’s transaction capacity to 5,000 transactions per second while slashing gas fees to near-zero levels, enhancing $OKB’s utility as the native gas token.
$OKB price outlook
$OKB’s price trajectory has pushed key technical metrics to extreme levels, with the Relative Strength Index (RSI) hitting overbought conditions.
Per the daily chart, $OKB’s price hovers at a level where the RSI is above 92 and signaling a potential reversal.
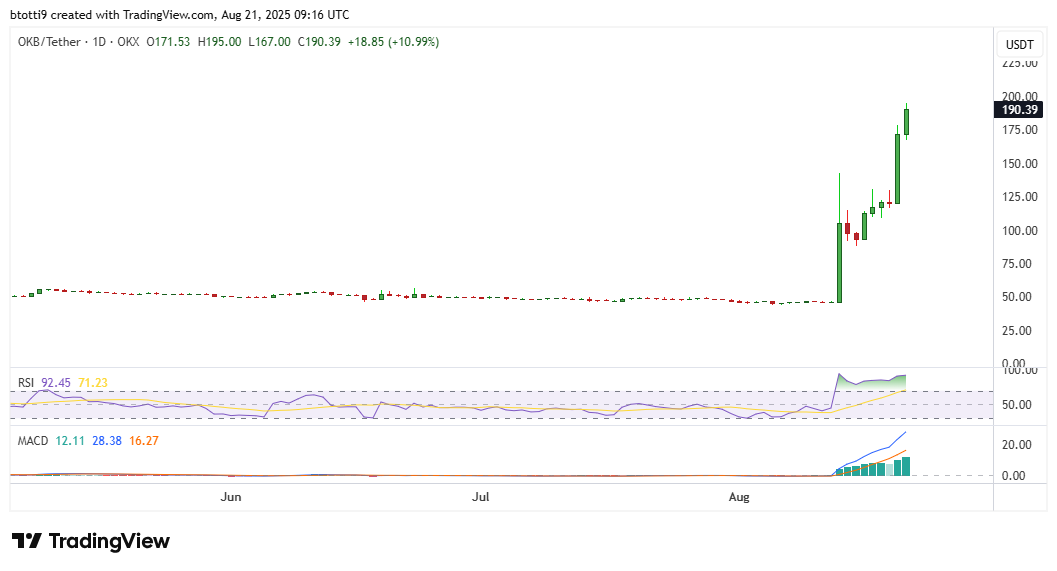
OKX price chart by TradingView
However, the Moving Average Convergence Divergence (MACD) remains strongly bullish, with the MACD line above the signal line.
This and the histogram’s outlook suggest sustained buying pressure.
If bulls weather profit-taking deals, the next target will be a spike above $200 and further price discovery.
On the downside, support levels include $125 and $92.

 coinjournal.net