
 u.today
$XRP's performance against Bitcoin is returning to a familiar pattern, and the charts are not looking good as August comes to a close. On the daily time frame, the pair is orbiting 0.000025 $BTC after failing to hold its push above 0.000030 $BTC.
The candles are below the midline of the Bollinger setup, and the bands are tighter, which often happens before a bigger move. Since $XRP is on the lower end of that range, it suggests that the bias is on the downside.
On the weekly chart, the pattern looks even clearer. The rally that started at the end of last year lifted $XRP from its lowest point in years, but it topped out quickly once it hit the 0.000030 zone.
Since then, weekly closes have been dropping, and it looks like they have hit a ceiling, similar to what we saw before. The rejection from the upper band leaves the pair in a position to support itself, and the next pocket that is easy to spot is closer to 0.000023 $BTC.
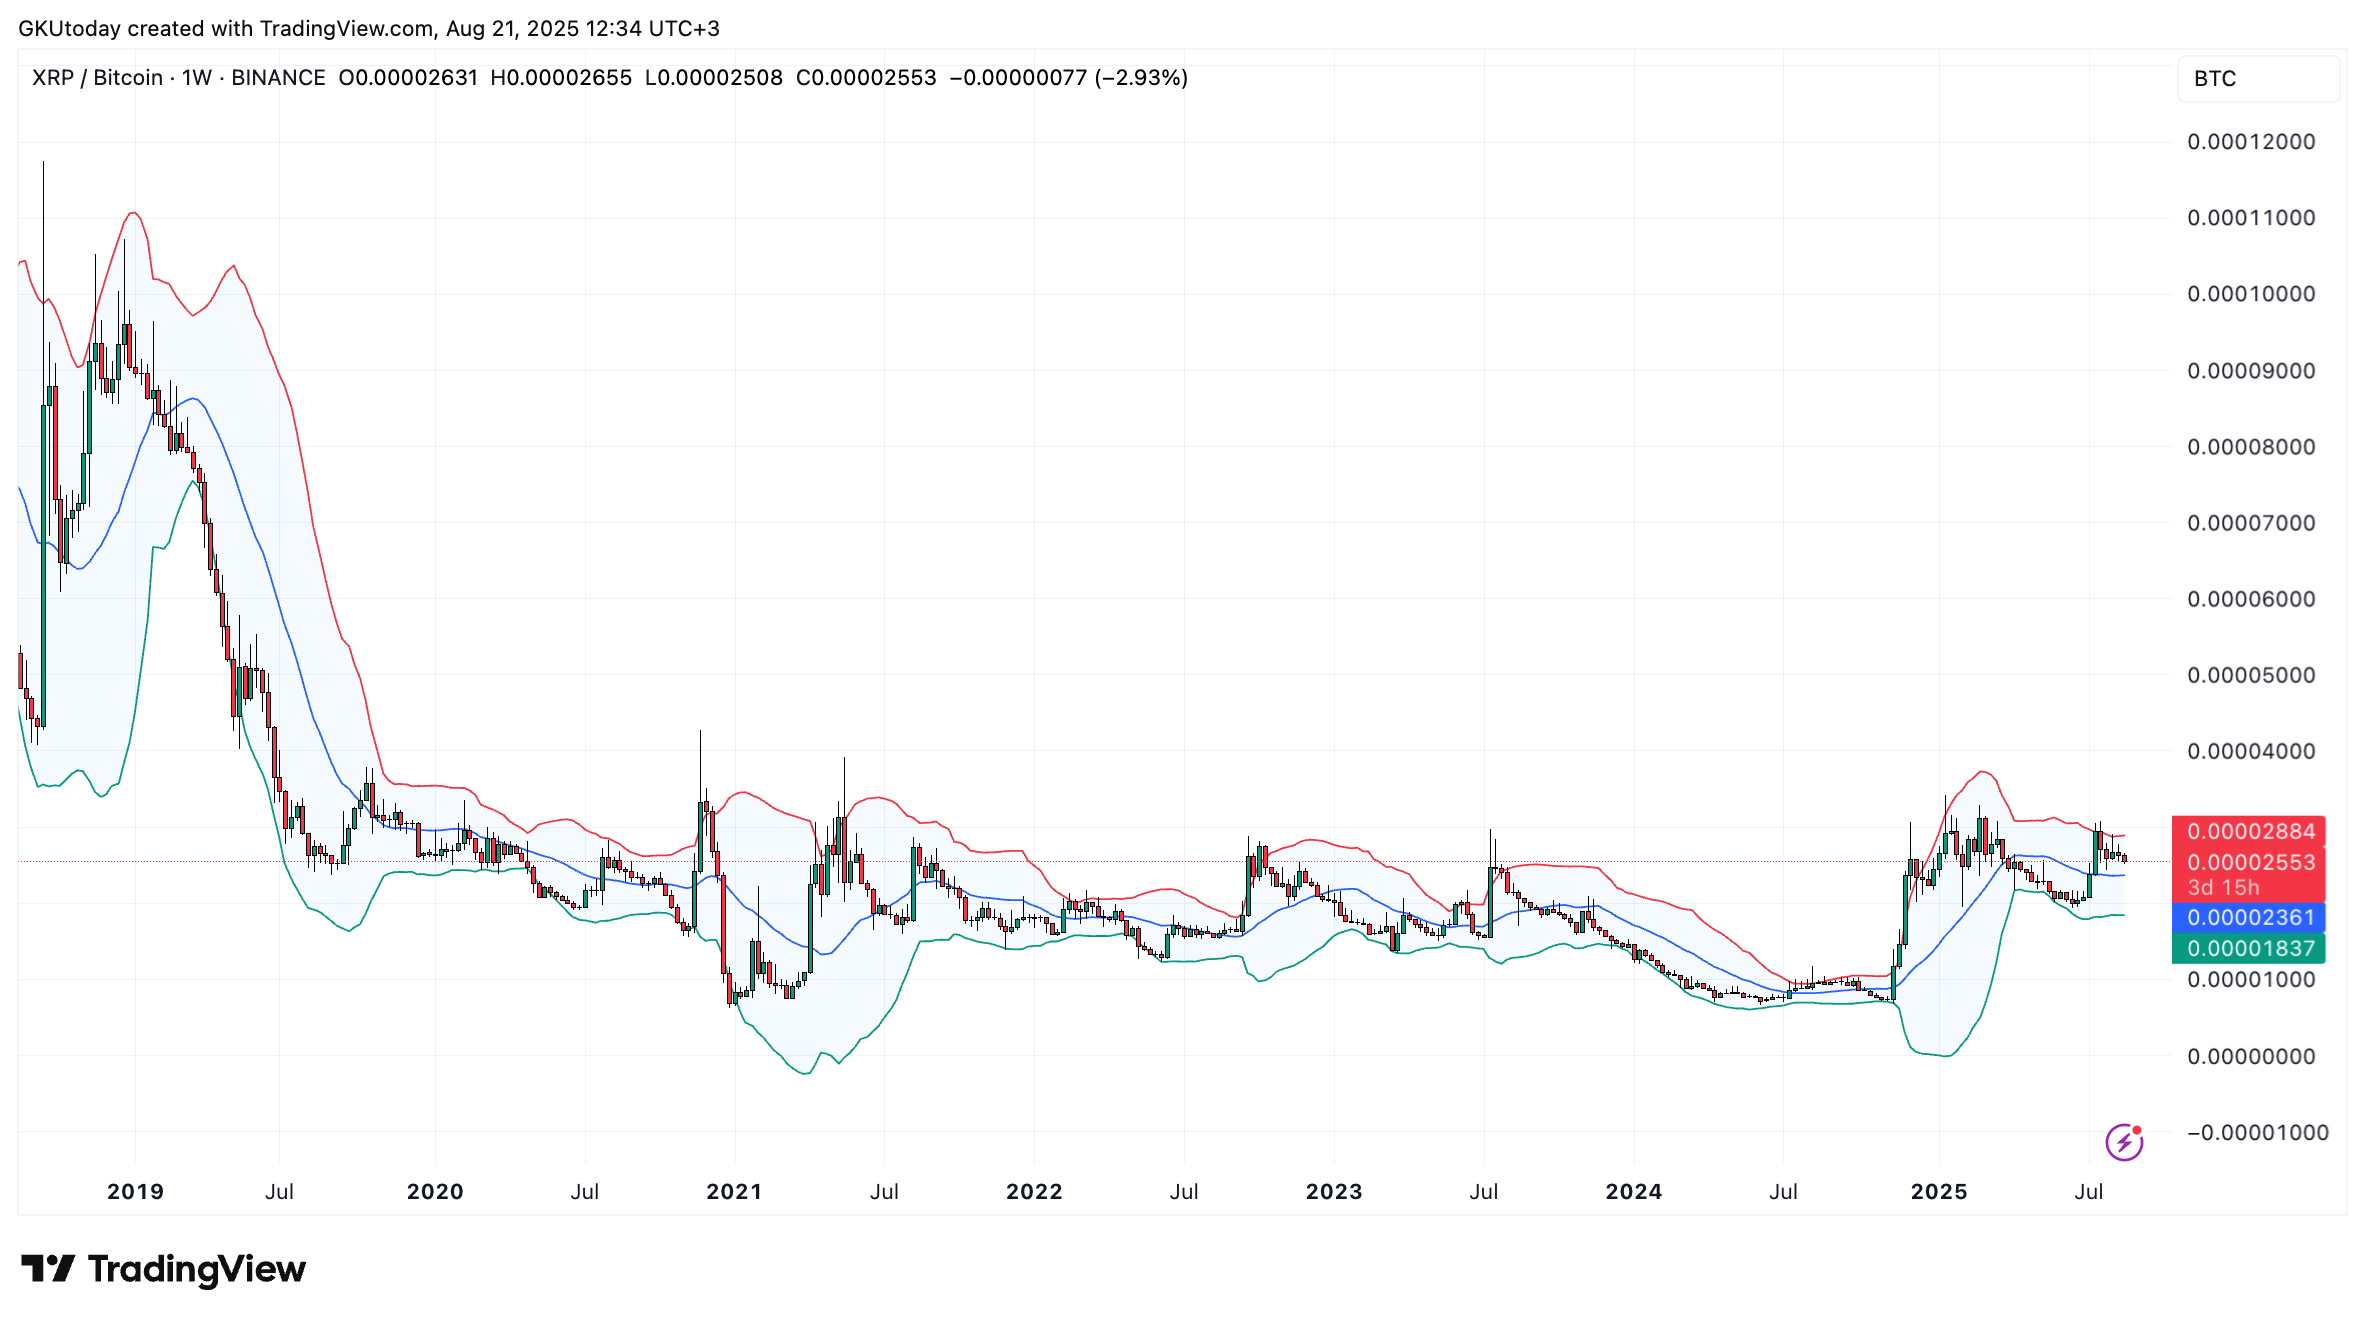
The monthly view tells the longest story. $XRP used to have ratios that put it in the same ballpark as Bitcoin — trading above 0.000100 $BTC in 2017 and even hitting 0.000200 $BTC at its peak. Those days are long gone.
What's next?
Every time there has been an attempt to recover, it has been cut down before crossing the long-standing ceiling around 0.000055 $BTC. That barrier has not been broken in over five years, and the market has seen every test as a chance to sell into strength.
When you put it all together, it looks like $XRP is entering another period where it is going to lag behind Bitcoin. With $BTC dominance still close to 59% and capital flow favoring the leading coin, altcoin pairs like $XRP/$BTC continue to show weakness.