$BNB price has jumped nearly 14% in the last 30 days and recently touched a new all-time high of $881. While the price is now trading just 2% below that mark, what matters more is how it’s holding firm above key resistance.
In the past 24 hours alone, $BNB gained another 3.4%, showing solid buyer interest. Two key on-chain signals suggest this rally may not be a one-off event. Both long-term and mid-term holders are backing this run.
HODLers Are Buying Into Strength — And They’re Not Alone
The chart below displays $BNB’s HODL waves — a metric that measures the duration investors have held their tokens without selling them. It splits all $BNB holders into age bands. The key here is the behavior of two specific groups: long-term holders (1–2 years) and mid-term conviction buyers (3–6 months).
On July 21, the 1–2 year band held just 6.56% of supply. That number has grown to 7.49% as of August 20. Similarly, the 3–6 month cohort rose from 1.5% to 7.3%. These are significant increases, especially when $BNB’s price went up during the same time.
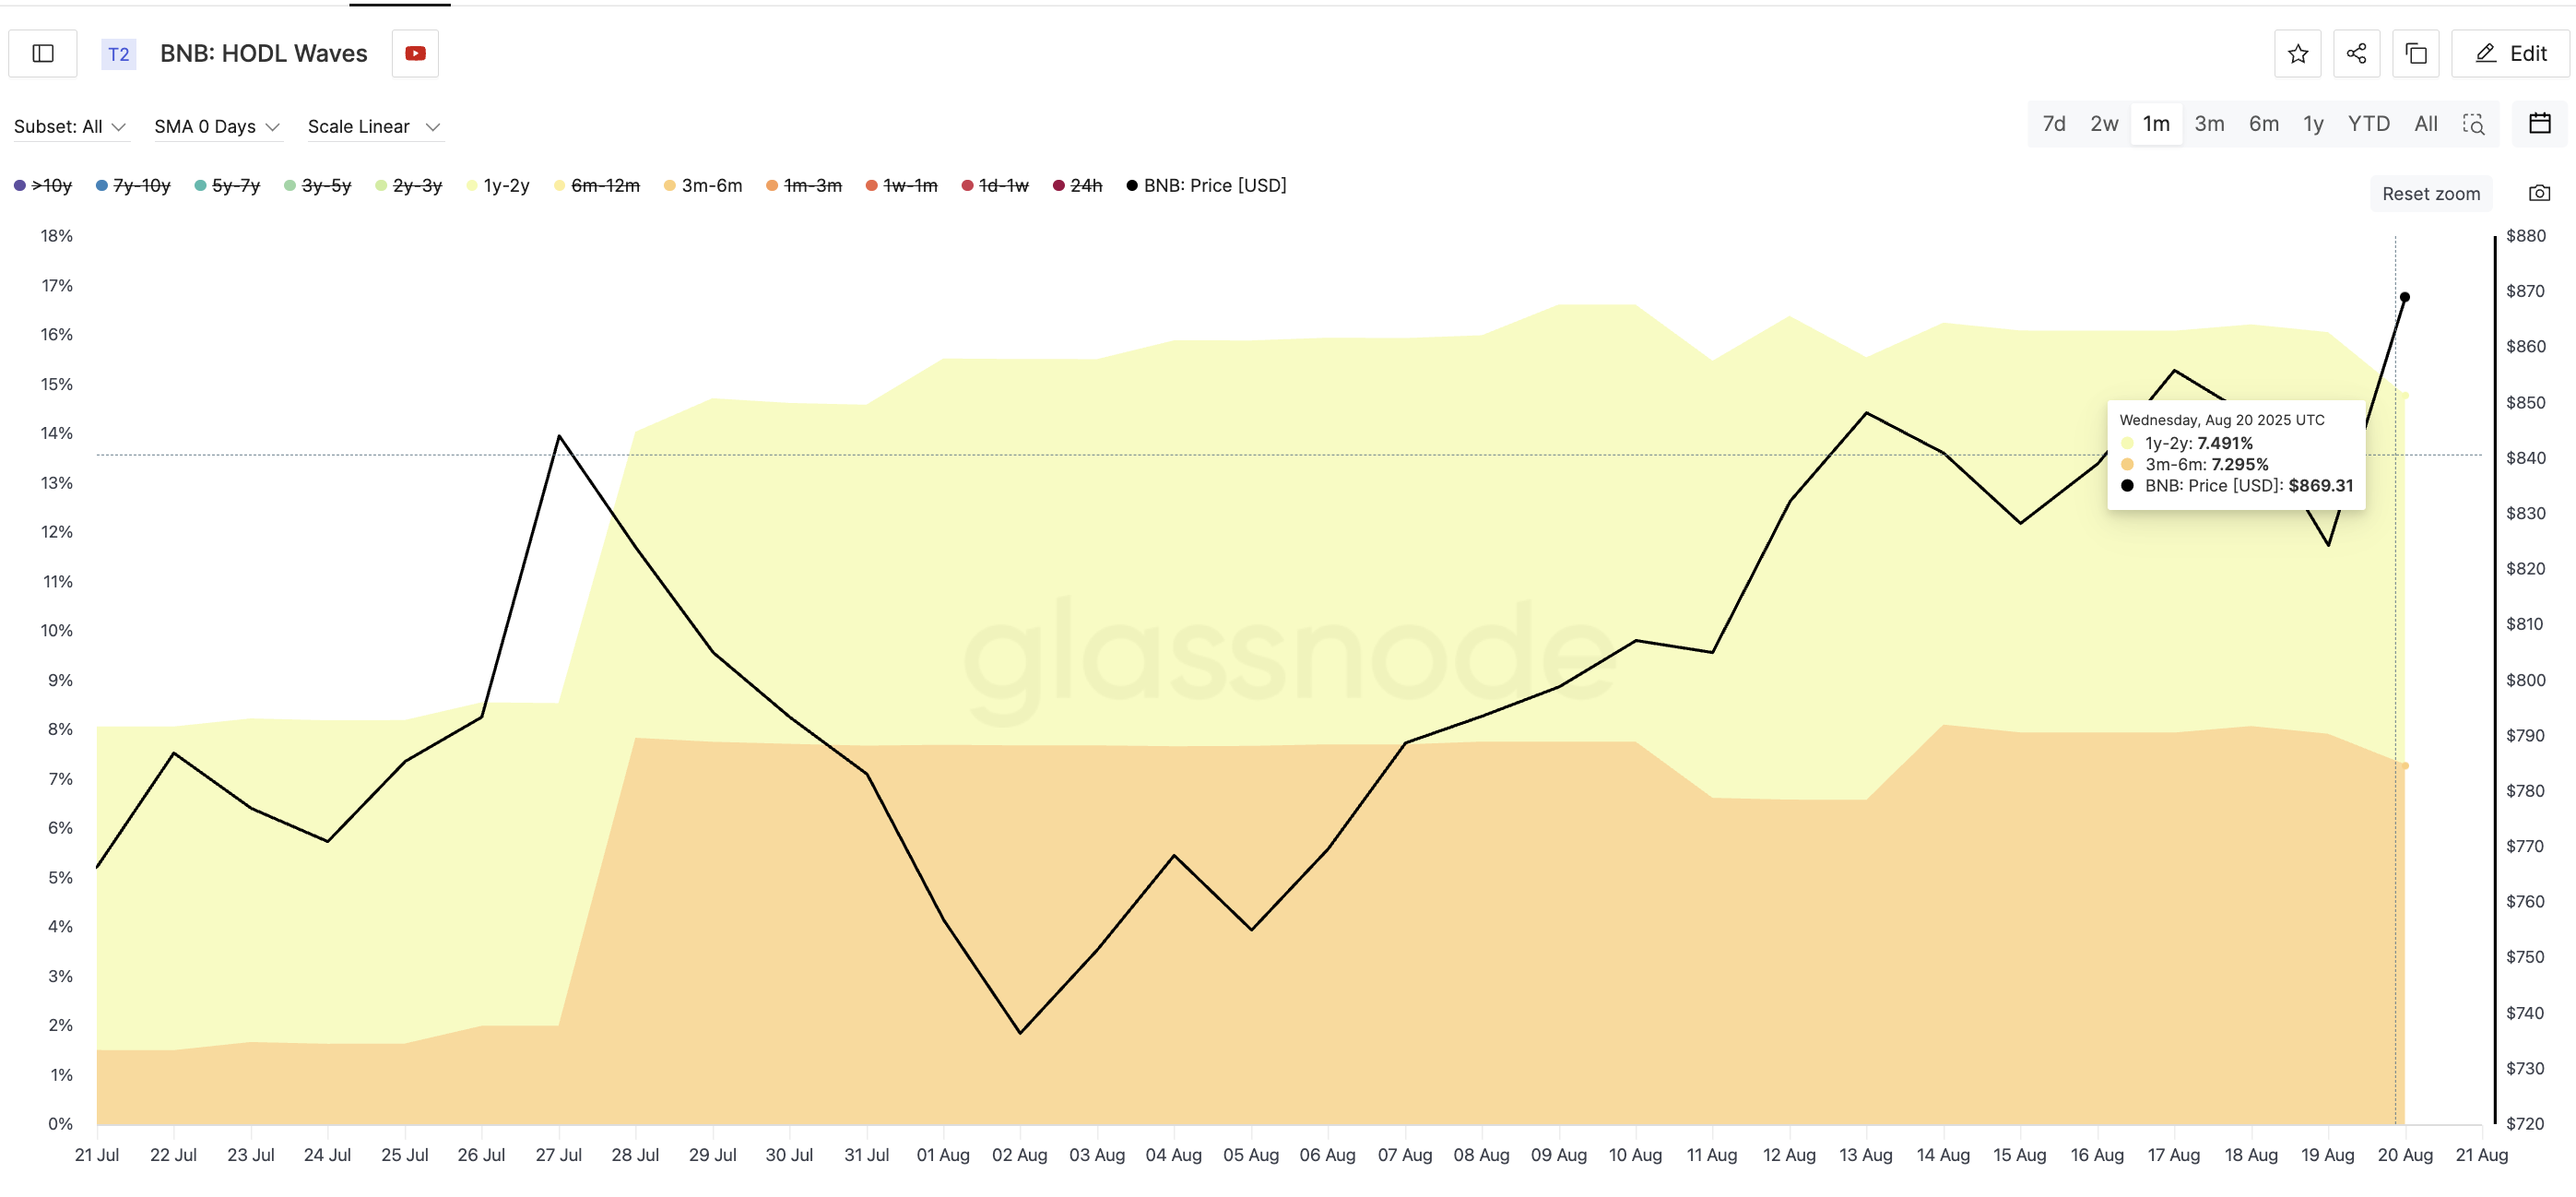
This kind of accumulation isn’t happening during a dip. It’s happening during a 14% $BNB price rally, meaning these holders aren’t waiting for a pullback. They’re stepping in on strength.
For token TA and market updates: Want more token insights like this? Sign up for Editor Harsh Notariya’s Daily Crypto Newsletter here.
Now look at exchange balances. Between August 19 and 20, $BNB’s price jumped from $824 to $869. Over the same period, exchange balances dropped from 31.91 million to 31.38 million $BNB — a 530,000 token drop in one day.
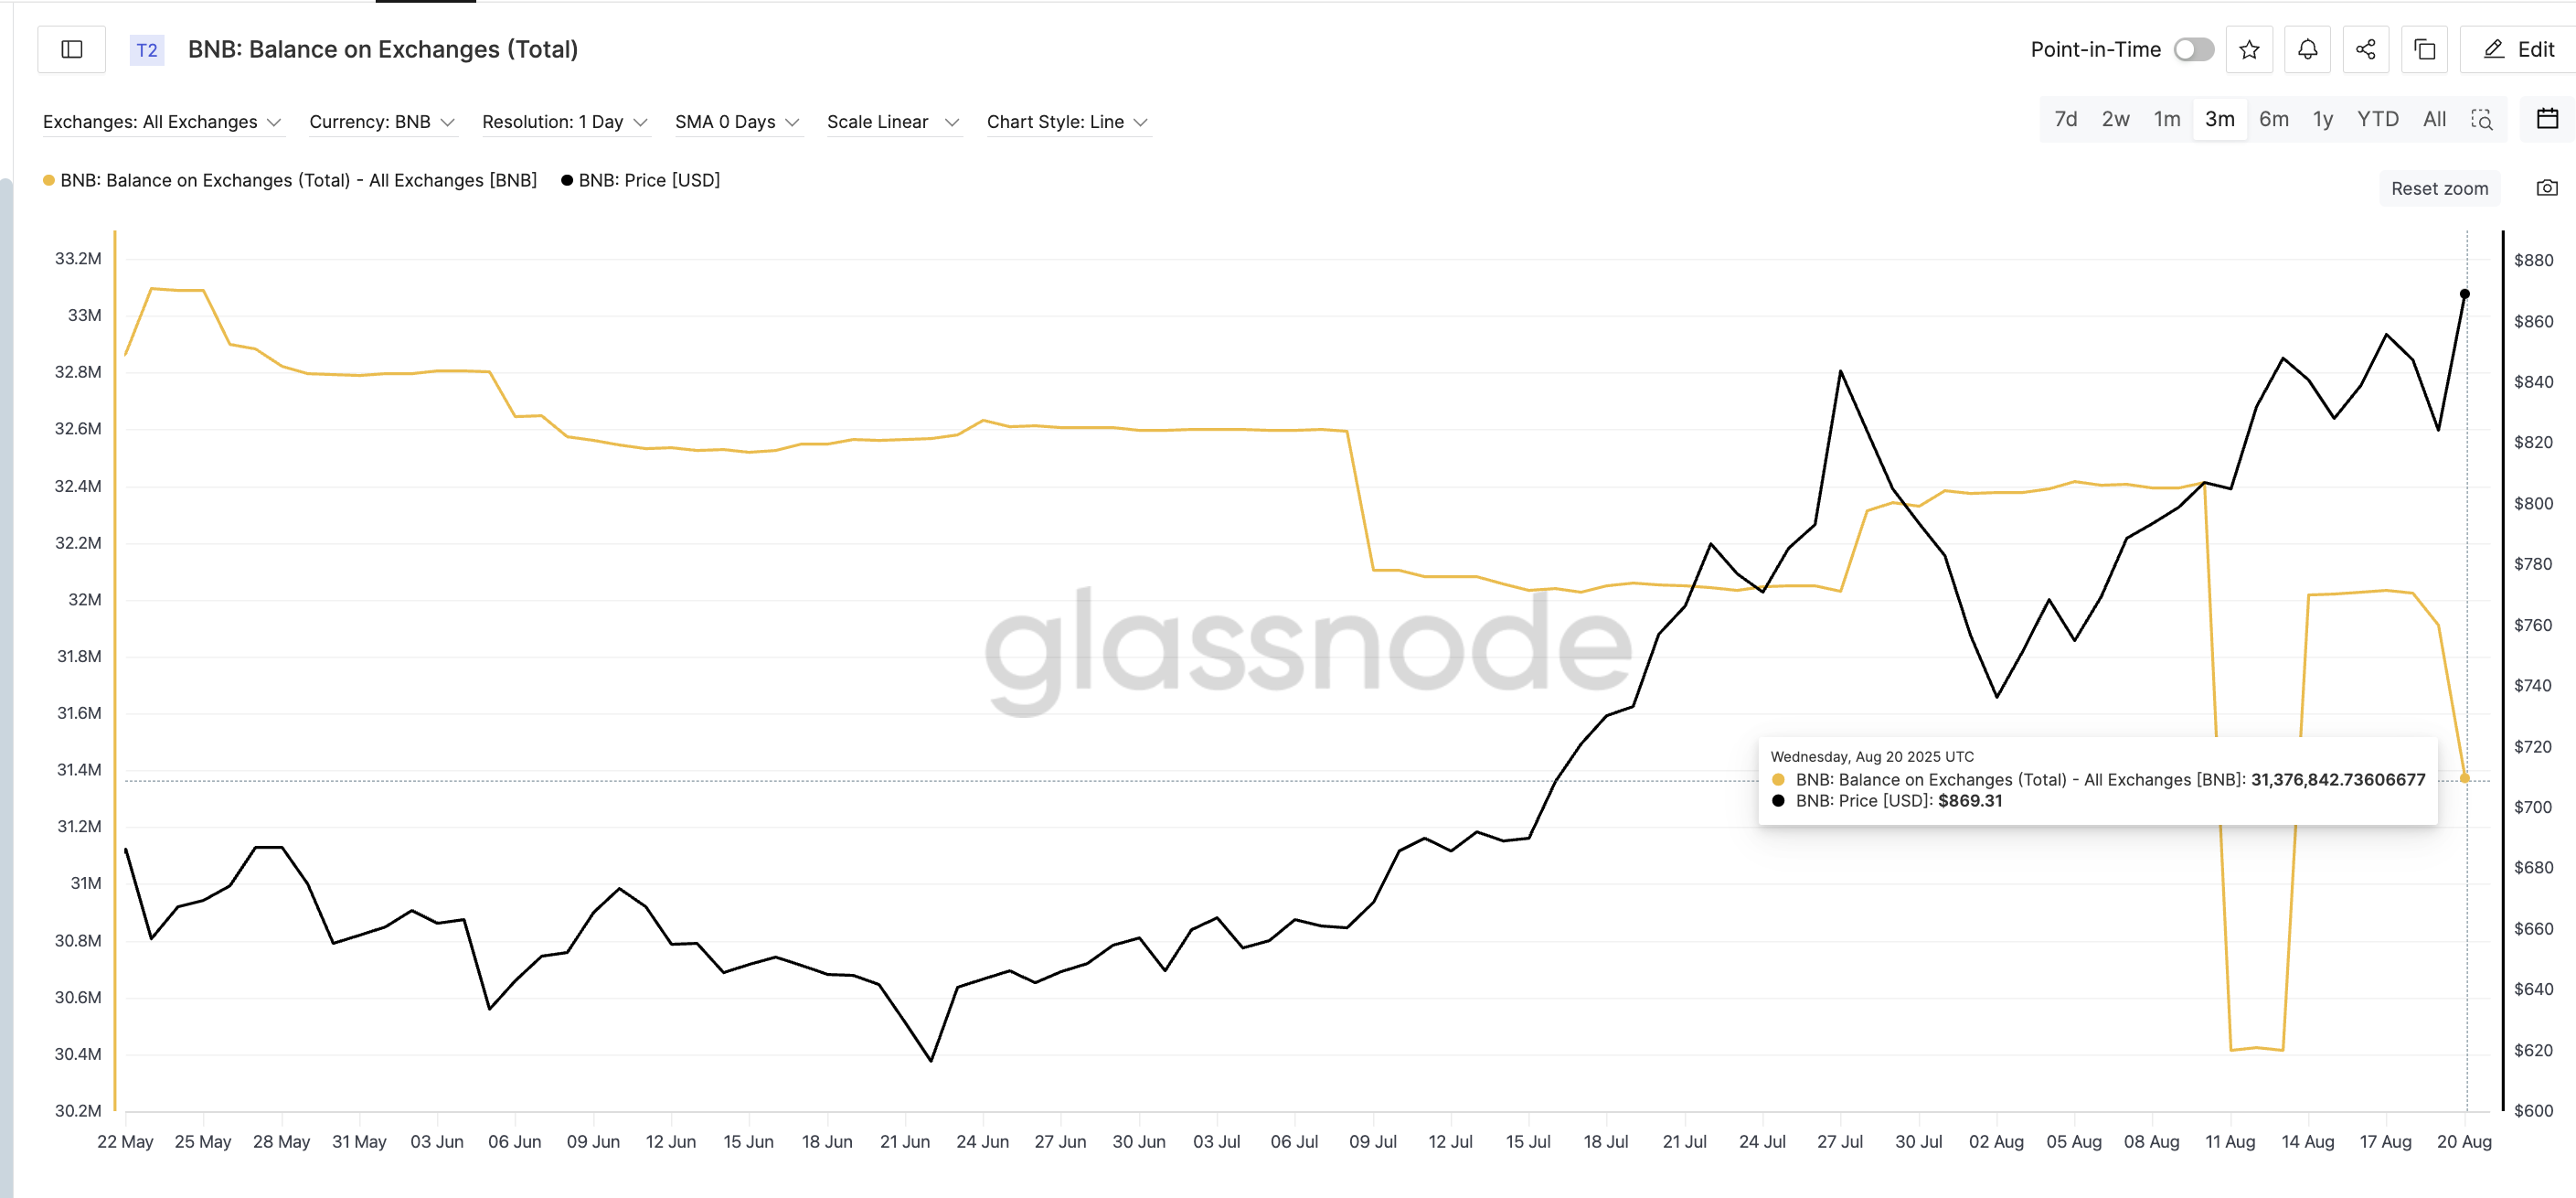
That means traders weren’t sending coins in to sell. They were pulling coins out. Combined with rising HODL bands, this is clear: $BNB holders expect higher prices.
$BNB Price Action Confirms That $881 Was Only the First Barrier
$BNB’s price rally hasn’t been random. It’s been following a clear uptrend, with pullbacks respecting Fibonacci retracement levels. The chart shows a trend-based Fib extension plotted from the recent impulse: $730 (start) to $864.95 (peak), retraced down to $812.
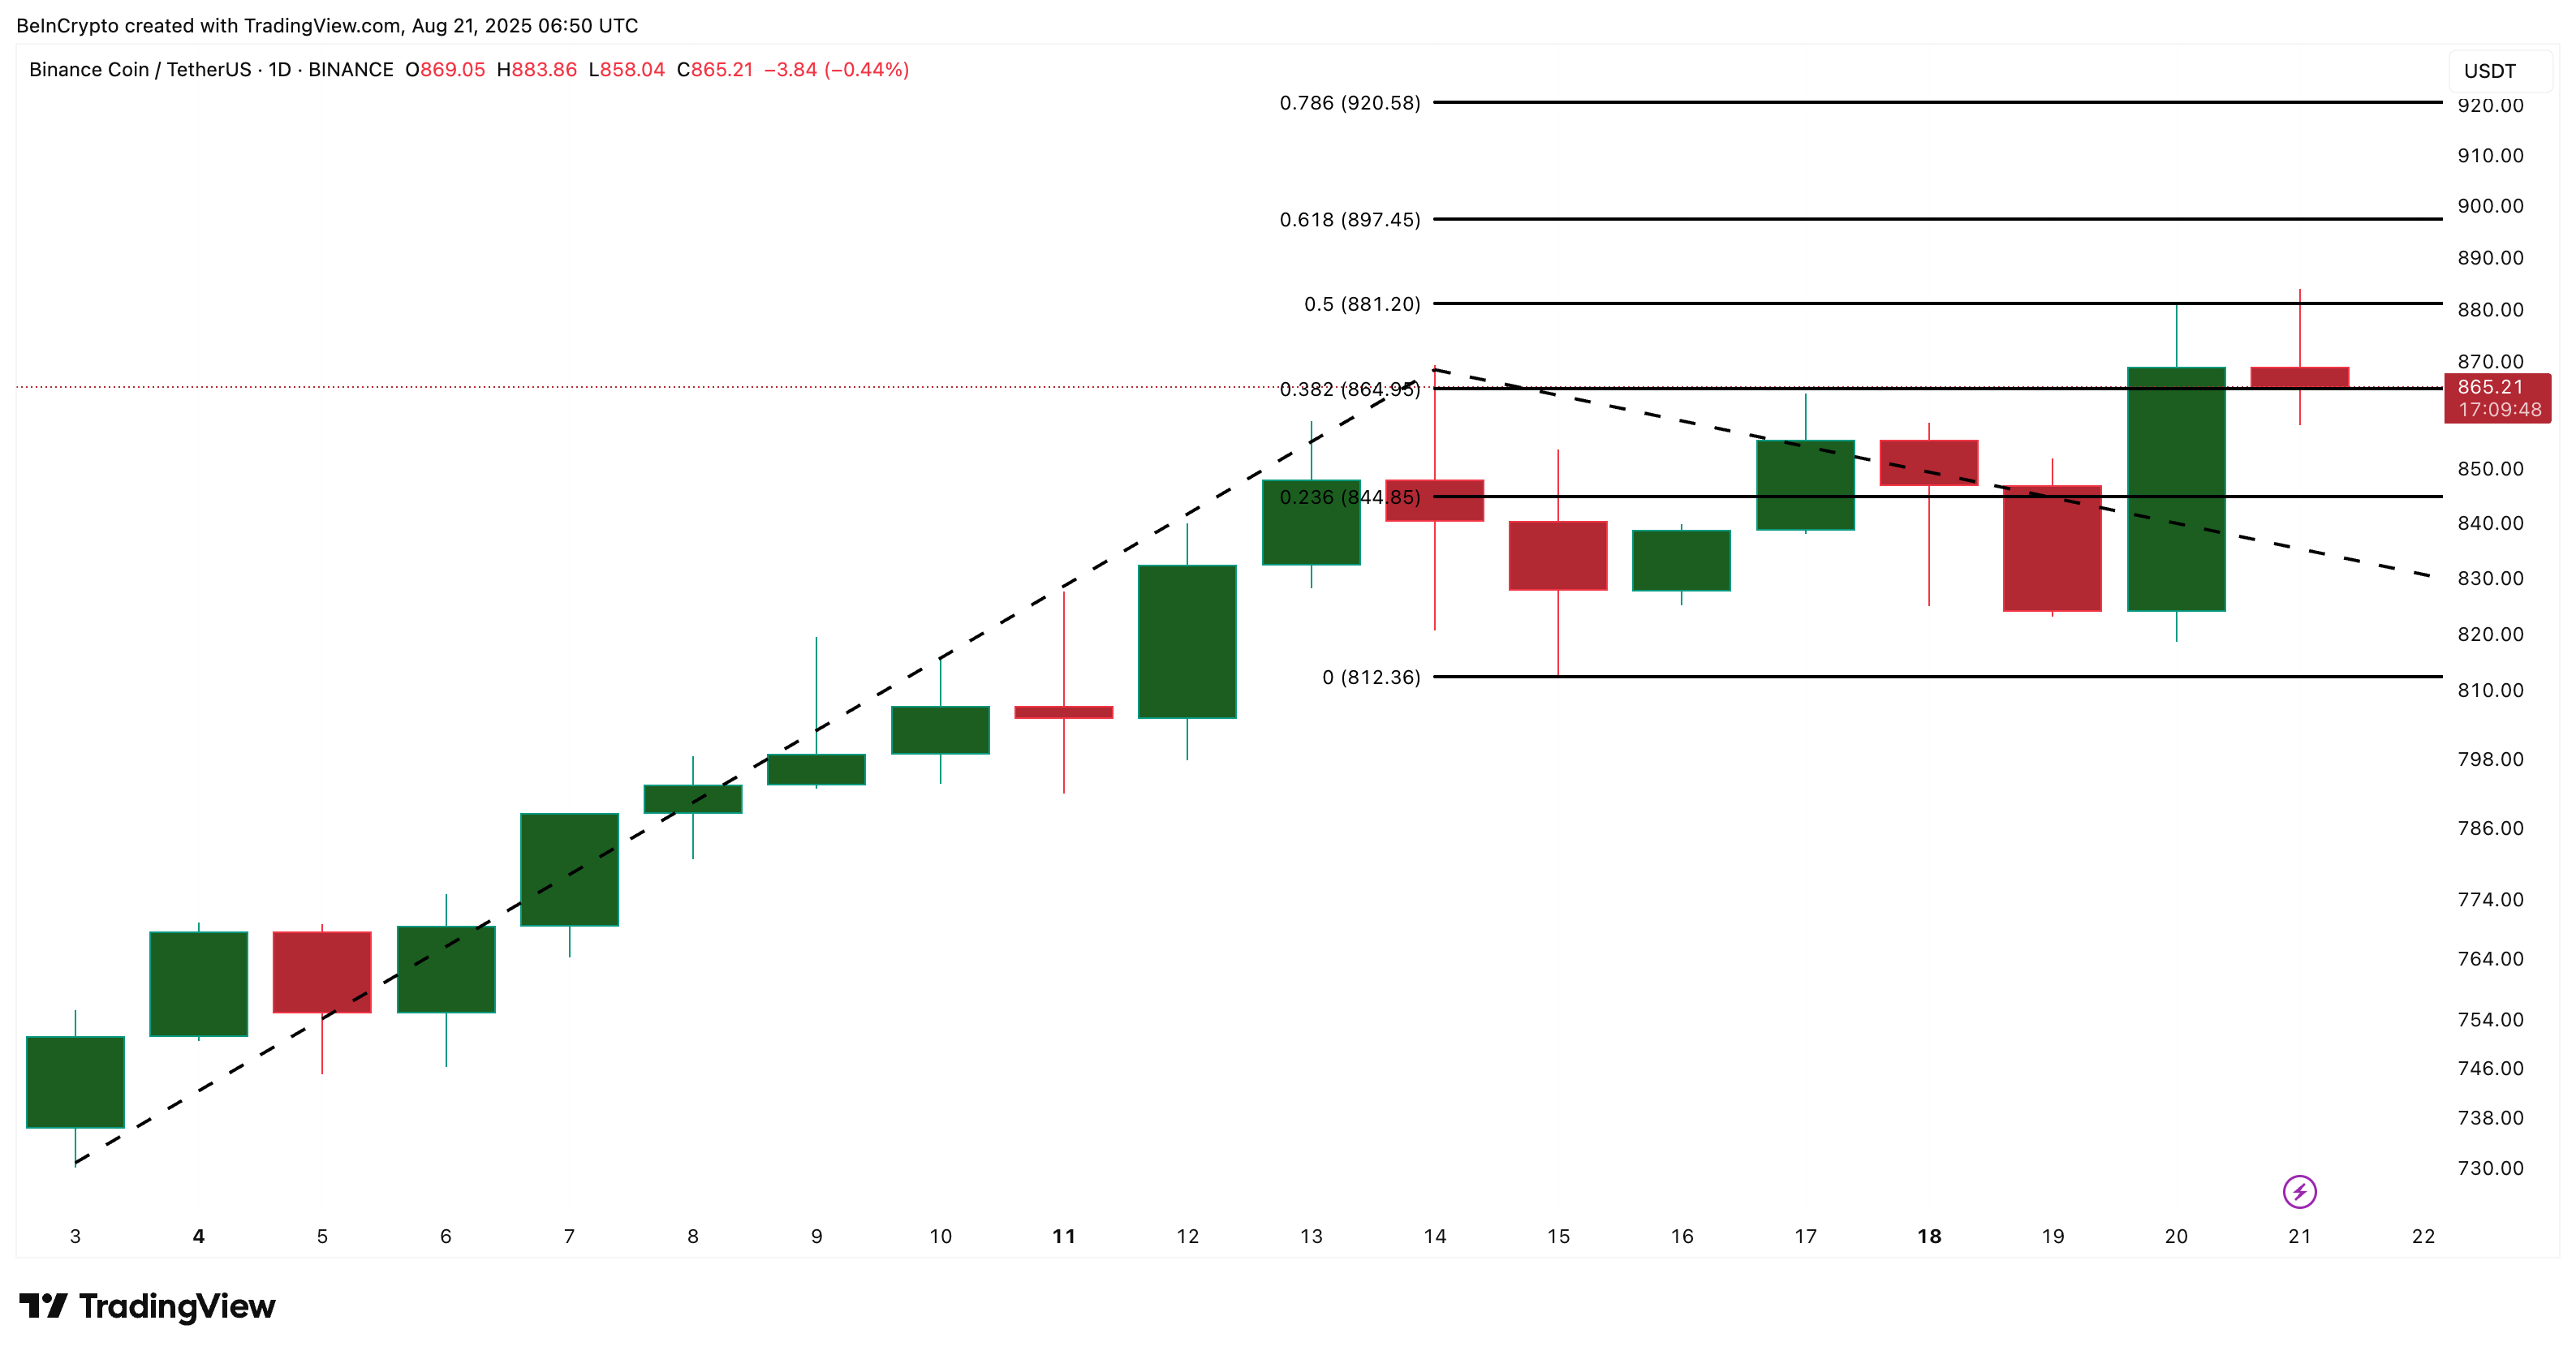
Based on that, the 0.5 level — $881 — acted as clear resistance and was tested almost perfectly. This test marked $BNB’s all-time high. If this resistance breaks, the next Fib levels at $897 and $920 open up; both would be fresh all-time highs.
But there’s one risk. If the $BNB price breaks below $812, the trend structure weakens. The level acted as the key retracement zone, and losing it would shift sentiment. But until then, the setup favors continuation.
The post $BNB’s New All-Time High Could Be the First of Many — Here’s Why appeared first on BeInCrypto.