When $XRP recovered from the Feb. 7 low, it formed another ascending trendline. Nonetheless, a breakdown occurred on Feb. 21, leading to a steeper 28% decline to $1.94 by Feb. 28. Meanwhile, the third trendline breakdown materialized on March 26, with $XRP crashing 22% to $1.89 by April 7.
From here, $XRP witnessed the fourth ascending trendline during a recovery push to $2.65 in mid-May. After this, another breakdown emerged, pushing $XRP to $1.9 by June, a level it recovered from to claim the latest $3.66 peak.
Another Steep Correction?
Now, Northstar’s chart reveals that a fifth breakdown has occurred amid the recent downtrend. As a result, the analyst expects $XRP to have the same reaction as the last four times. For context, the average drop from the previous instances is 20%. If $XRP records such a decline, its price could find a floor around the $2.4 mark.
Interestingly, this aligns with a recent commentary from EGRAG Crypto, a reputable analyst. EGRAG noted that if $XRP pushes above $3.65, its price could soar higher. However, he said a drop below $2.65 could lead to steeper declines to the $2.34 level, close to the $2.4 mark.
Also, a closer look at the daily $XRP chart shows that $XRP boasts its first major support around $2.36 (S1). Meanwhile, $XRP may have a chance at overturning this bearish situation if it pushes above the ascending trendline. To do this, it must first reclaim and hold above the Pivot point at $2.94 and then aim for the $3.52 resistance.
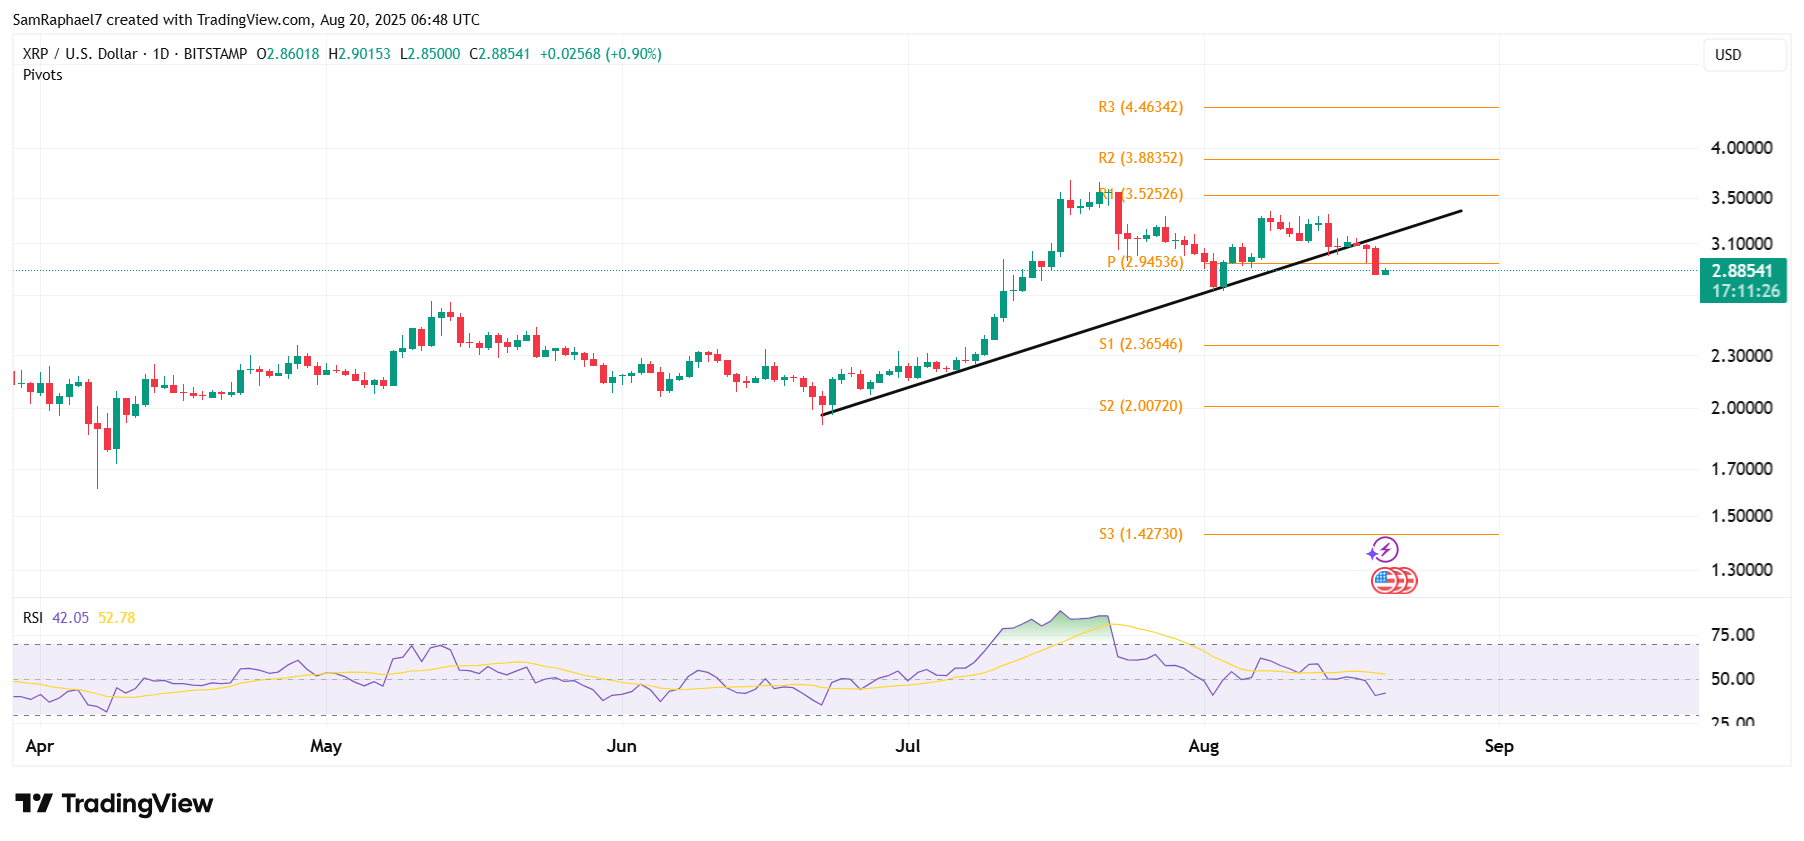
$XRP 1D Chart
EGRAG has also suggested that if $XRP can close above $3.3 this month, its momentum could flip bullish. However, even if the asset collapses 20% toward $2.4, a recovery is not out of the question, as this could merely be a healthy correction. Currently trading for $2.88, $XRP’s RSI remains 42, signaling there is more room for growth.

 thecryptobasic.com