
- Bitcoin price falls below the ascending trendline, signaling a shift from a bullish to bearish market structure.
- Ethereum slips below its support at $4,232, with bears eyeing levels below $4,000.
- Ripple’s $XRP closes below its 50-day EMA at $2.93, hinting at further correction ahead.
Bitcoin ($BTC), Ethereum ($ETH), and Ripple ($XRP) all closed below key support zones as the correction deepens this week. $BTC has fallen under its ascending trendline, and $ETH slipped below the critical level with eyes on levels below $4,000. At the same time, $XRP closed under its 50-day Exponential Moving Average (EMA) at $2.93, with all these top 3 currencies suggesting further downside pressure ahead.
Bitcoin breaks below the ascending trendline, changes market structure
Bitcoin price extended the decline, closing below $116,300 as the week started, and on Tuesday, it closed below an ascending trendline drawn by connecting multiple lows since early April. During the same period, $BTC also closed below the 50-day EMA at $114,903. At the time of writing on Wednesday, it recovers slightly at around $113,400.
If $BTC continues its pullback, it could extend losses toward its next support level at $111,980.
The Relative Strength Index (RSI) reads 41 on the daily chart, below its neutral level of 50, indicating bearish momentum. The Moving Average Convergence Divergence (MACD) showed a bearish crossover last week, suggesting a downward trend.
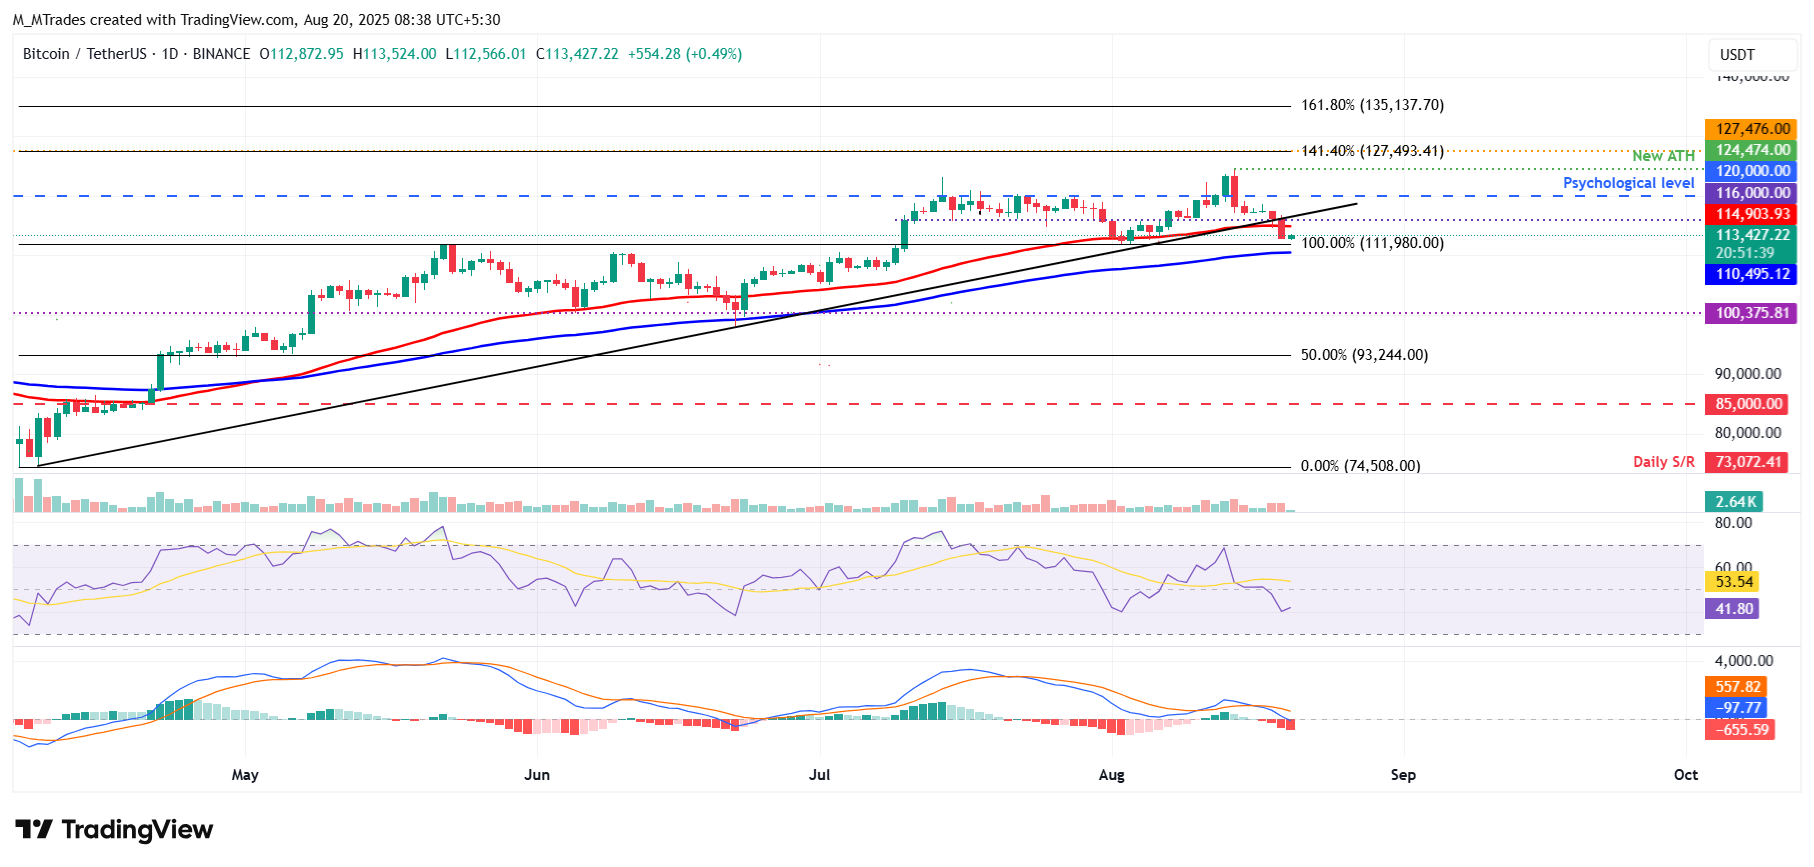
$BTC/$USDT daily chart
However, if $BTC recovers, it could extend the recovery toward its daily level at $116,000.
Ethereum momentum indicators show weakness
Ethereum price reached a new yearly high of $4,788 last week on Thursday, but failed to continue its upward trend and declined nearly 14% in the next five days until Tuesday. At the time of writing on Wednesday, it trades at around $4,132.
If the daily resistance at $4,232 holds as resistance, it could extend the decline toward its next key support at $3,946.
The RSI on the daily chart reads 53, retreating from overbought territory last week and pointing downward, indicating fading bullish momentum. The MACD showed a bearish crossover on Tuesday, further supporting the bearish thesis.
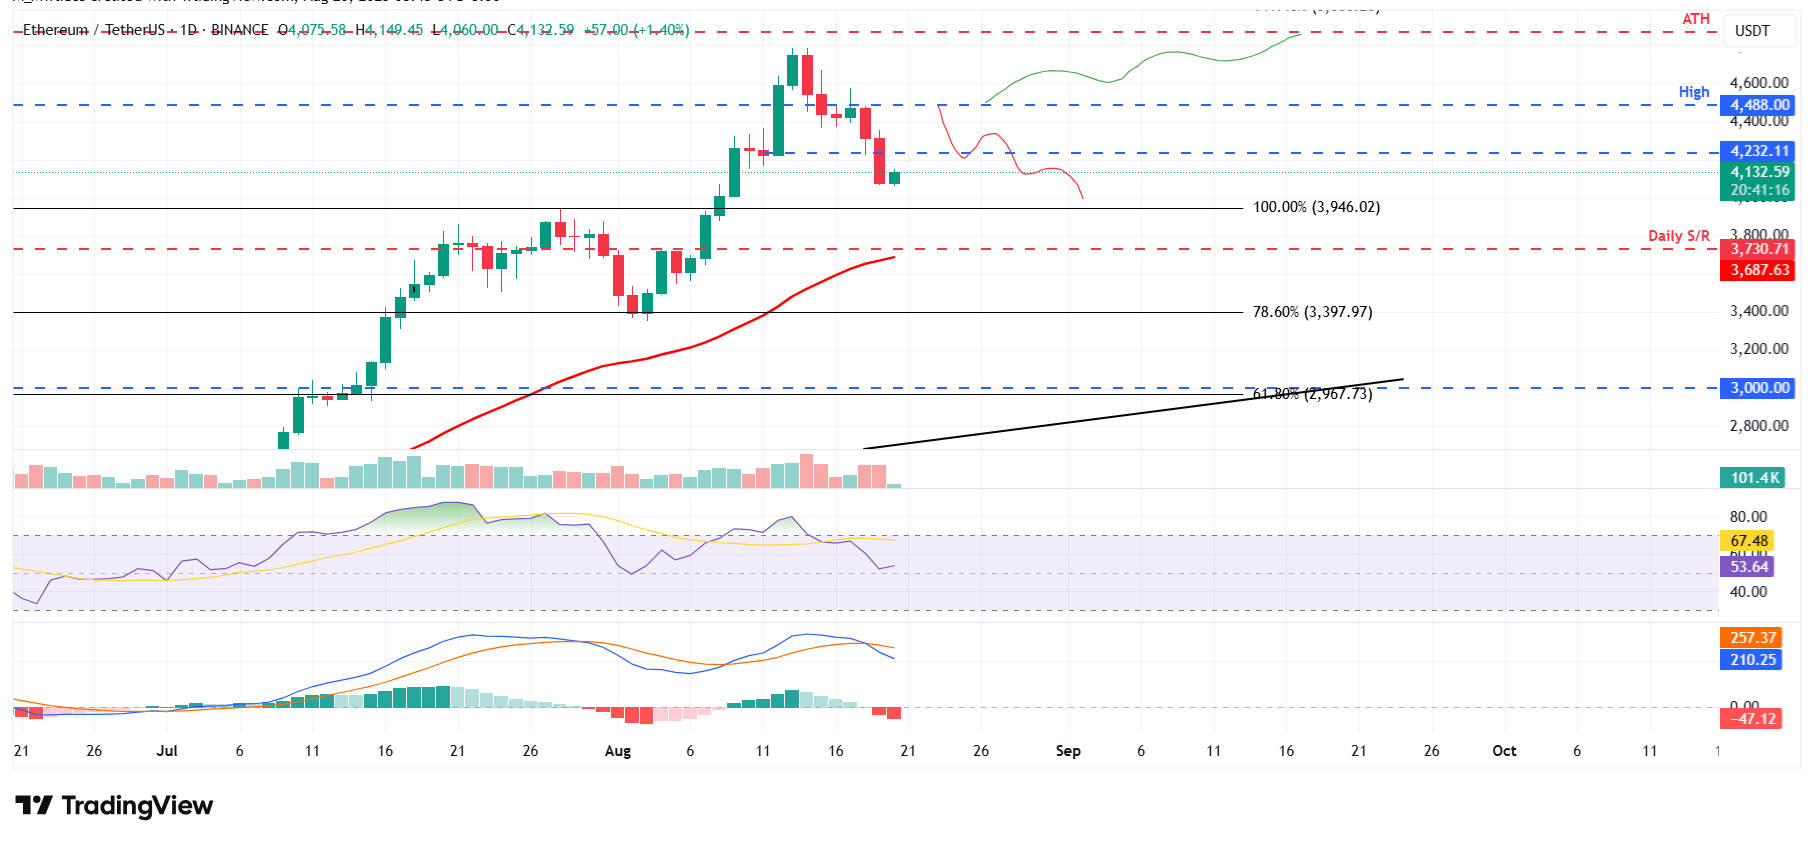
$ETH/$USDT daily chart
On the other hand, if $ETH recovers and closes above the daily resistance at $4,232, it could extend the rally toward its daily resistance at $4,488.
$XRP slips below key level, signaling further correction
Ripple’s $XRP faced rejection around the daily level of $3.40 on August 14 and declined over 12% in the next five days, closing below the 50-day EMA at $2.93 on Tuesday. At the time of writing on Wednesday, it hovers at around $2.88.
If $XRP continues its correction, it could extend the decline toward its next support level at $2.72.
Like $BTC, $XRP’s momentum indicators, RSI and MACD, also support the bearish thesis.
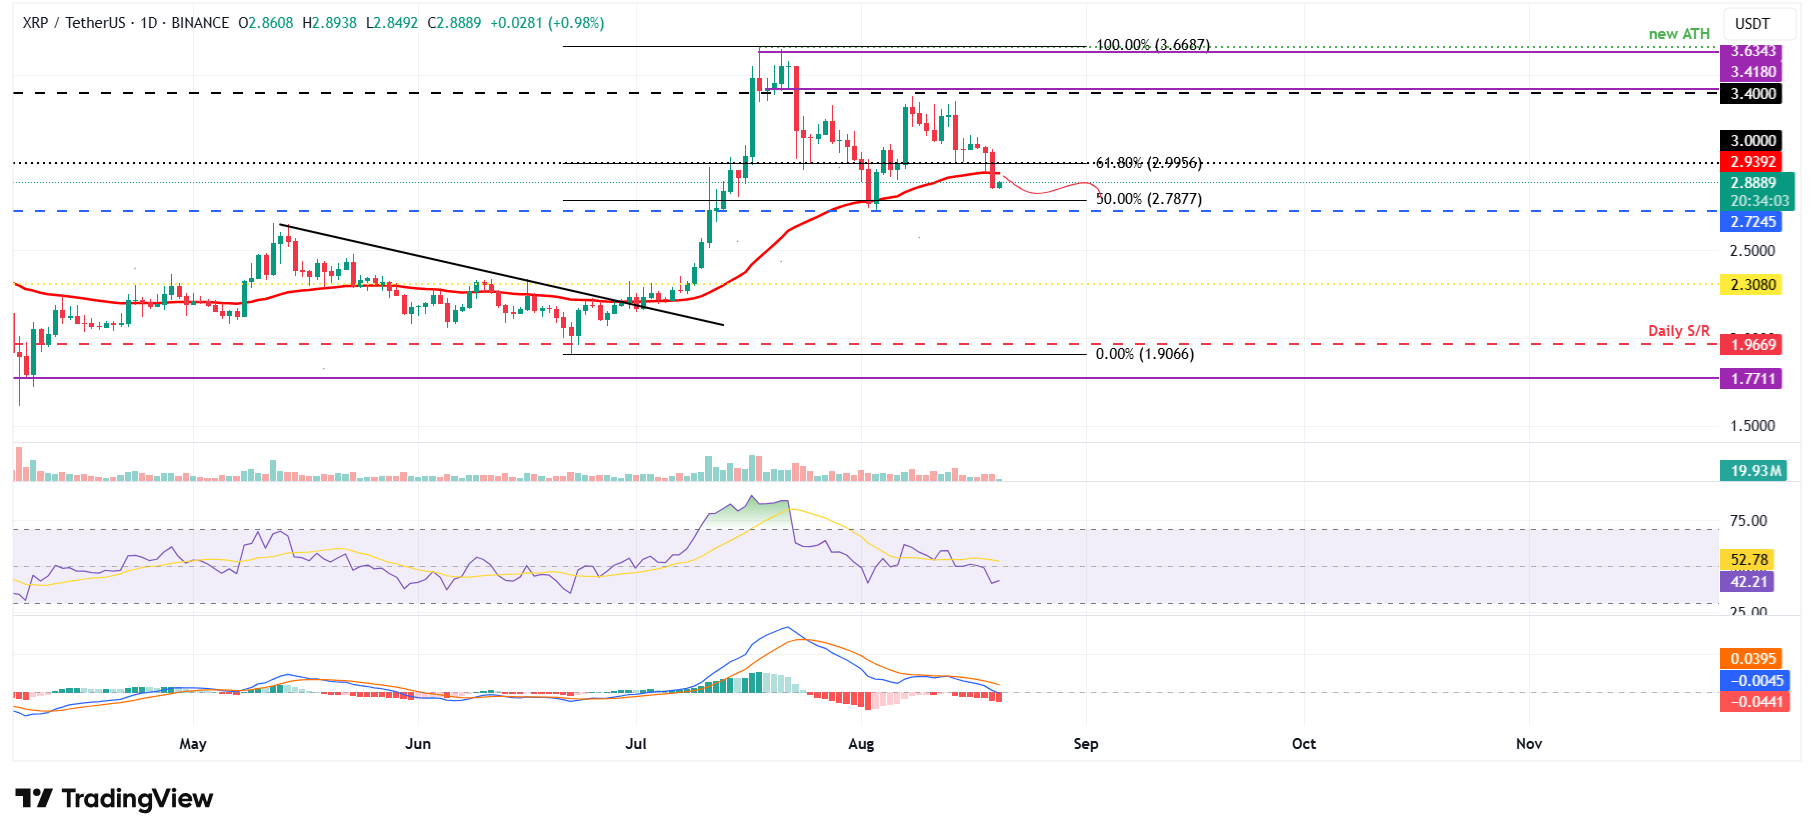
$XRP/$USDT daily chart
Conversely, if $XRP recovers, it could extend the recovery toward its daily resistance at $2.99.
(This story was corrected on August 19 at 05:00 GMT to say Ethereum's could extend the rally toward its daily resistance at $4,488 not record high of $4,868).