Key technical points
-
Key Support: $0.31 high time frame level, in confluence with a bullish retest.
-
Trend Structure: Consecutive higher highs and higher lows with 50 MA support intact.
-
Next Resistance: $0.43 high time frame resistance once swing high is breached.
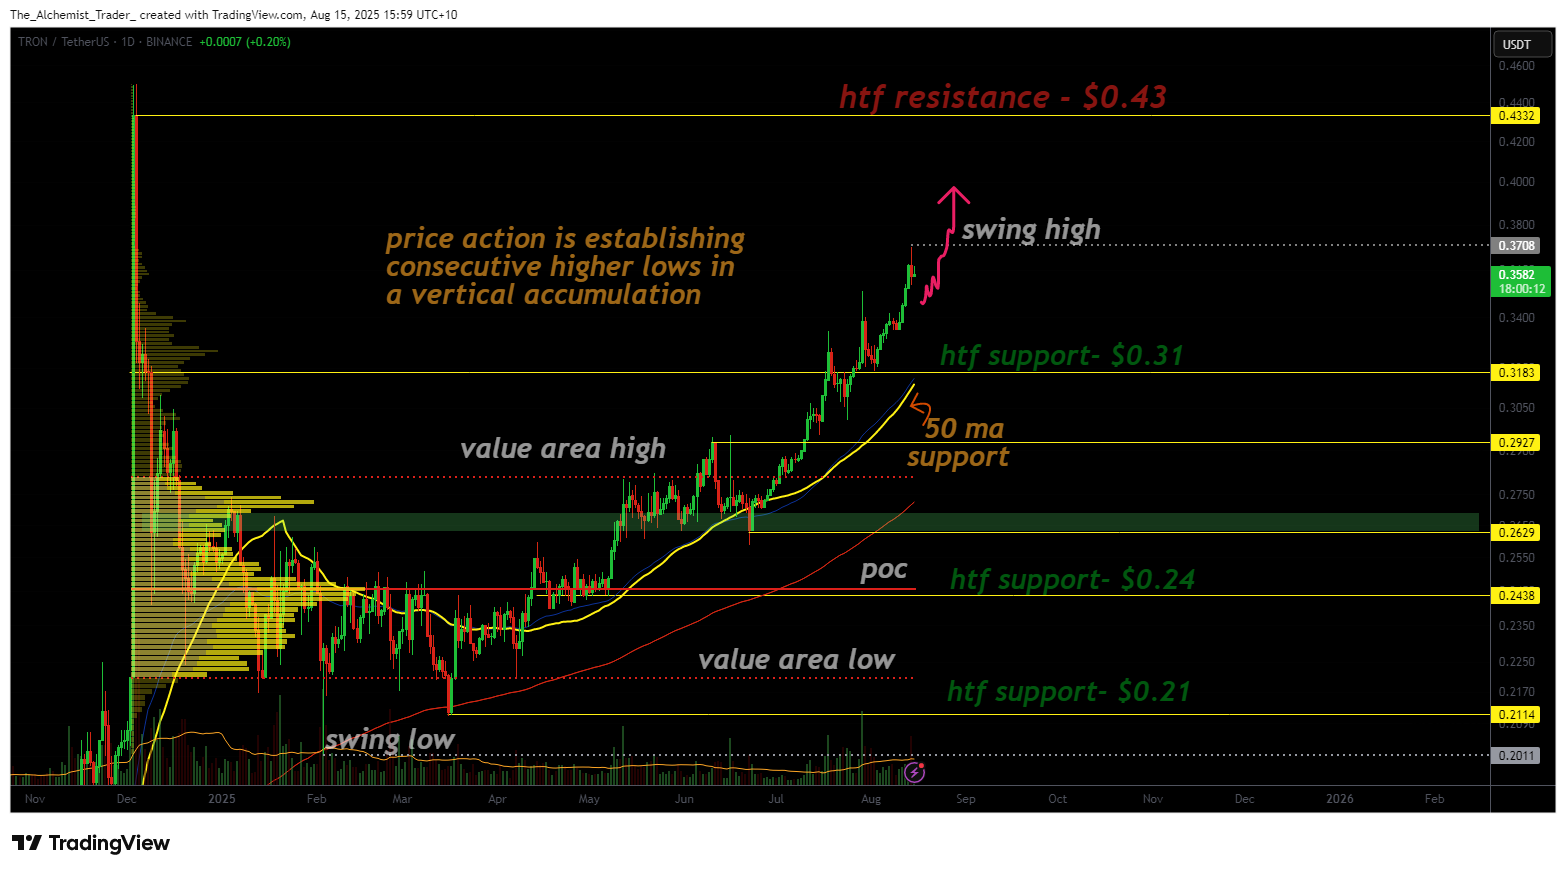
TRXUSDT (1D) Chart, Source: TradingView
Price action on Tron has established a consistent bullish trend, characterized by a vertical accumulation pattern where each pullback forms a higher low, followed by a swift push to new highs. The 50-day moving average has been acting as a reliable support zone, helping sustain the bullish trend on the higher time frames.
The $0.31 high time frame support has already been backtested successfully, confirming its role as a strong demand zone. Even in the event of a revisit, this level is expected to remain structurally bullish and provide a potential springboard for further upside.
Currently, $TRX is approaching its swing high. A bullish breakout above this level would likely open the door for a push toward the $0.43 resistance, a significant high time frame barrier. Breaking and holding above $0.43 would mark a major technical milestone and signal continued bullish control.
Volume analysis further supports the bullish thesis. The volume profile shows consistent bullish influxes, indicating healthy market participation. This sustained demand suggests that buyers remain active and committed to driving price higher. In vertical accumulations, rallies often persist until a blow-off top or climatic volume spike forms, something not yet visible in Tron’s current price action.
What to expect in the coming price action
As long as Tron maintains its vertical accumulation structure and holds the $0.31 support, the probability favors continued upside toward $0.43. A volume-backed breakout above this level could accelerate momentum toward new highs.

 crypto.news