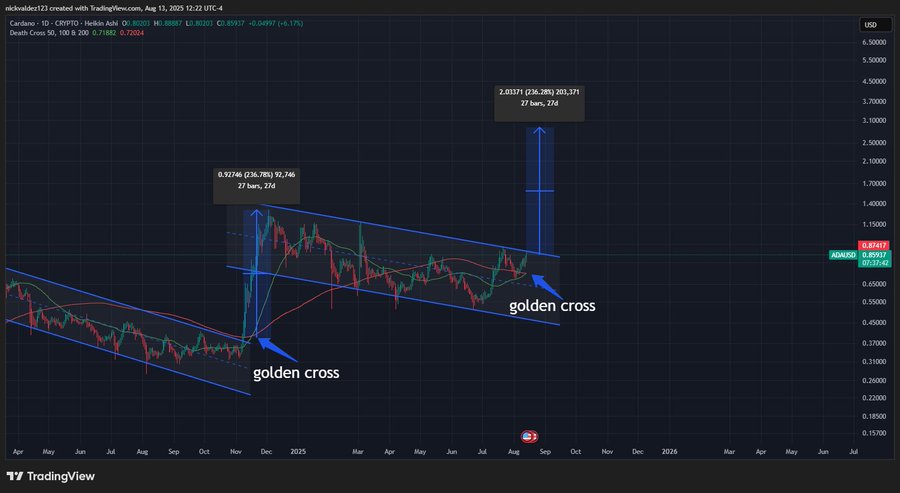
Cardano has observed the formation of a golden cross, with its 50-period moving average moving above the 200-period moving average.
Historical Rally After Previous Signal
According to market analyst Crypto Deezy, the last time $ADA formed this golden cross was in December 2024. After this, it rallied about 237% in 27 days. That move lifted the price from below $0.40 to more than $1.40. Notably, data from TradingView corroborates this value, showing a move of 0.92746 in value.
Meanwhile, at press time, $ADA is trading at $1.01, gaining more than 19% and 35.4% in the past day and month, respectively.

$ADA has now moved above its value-area low and is targeting the higher-timeframe resistance at $1.19, with the swing high at $1.3264 as a potential next objective. The chart highlights a triple-bottom formation at the $0.49 support zone, confirming it as a key level for bulls to defend.
Holding above the POC and value-area high could pave the way for continued upside, while a drop back below $0.49 would invalidate the bullish outlook.
How High Can Cardano Go?
In a separate disclosure, prominent analyst Ali Martinez said Cardano could reach $1.50 if the price clears key resistance at $0.94. His chart shows an inverse head-and-shoulders pattern with the neckline at $0.94, where a breakout could fuel moves toward $1.20 and $1.50. Notably, Cardano now trades above the neckline.
Meanwhile, analyst Christopher Visser is particularly more bullish. He suggested that Cardano is nearing a breakout after four years of consolidation, backed by bullish MACD crossovers and a rare six-hour Bollinger Band squeeze.
He sees strong support at $0.73–$0.74 and thin resistance above, with a potential long-term target of $3.91, over 350% above current prices and beyond its $3.1 all-time high.
Similarly, analyst Dan Gambardello revealed that Cardano’s setup and risk score match December 2020, before $ADA’s run to $3.09, and projects a possible move toward $3, a 197% gain from current levels.