$XRP price dynamics (Source: TradingView)
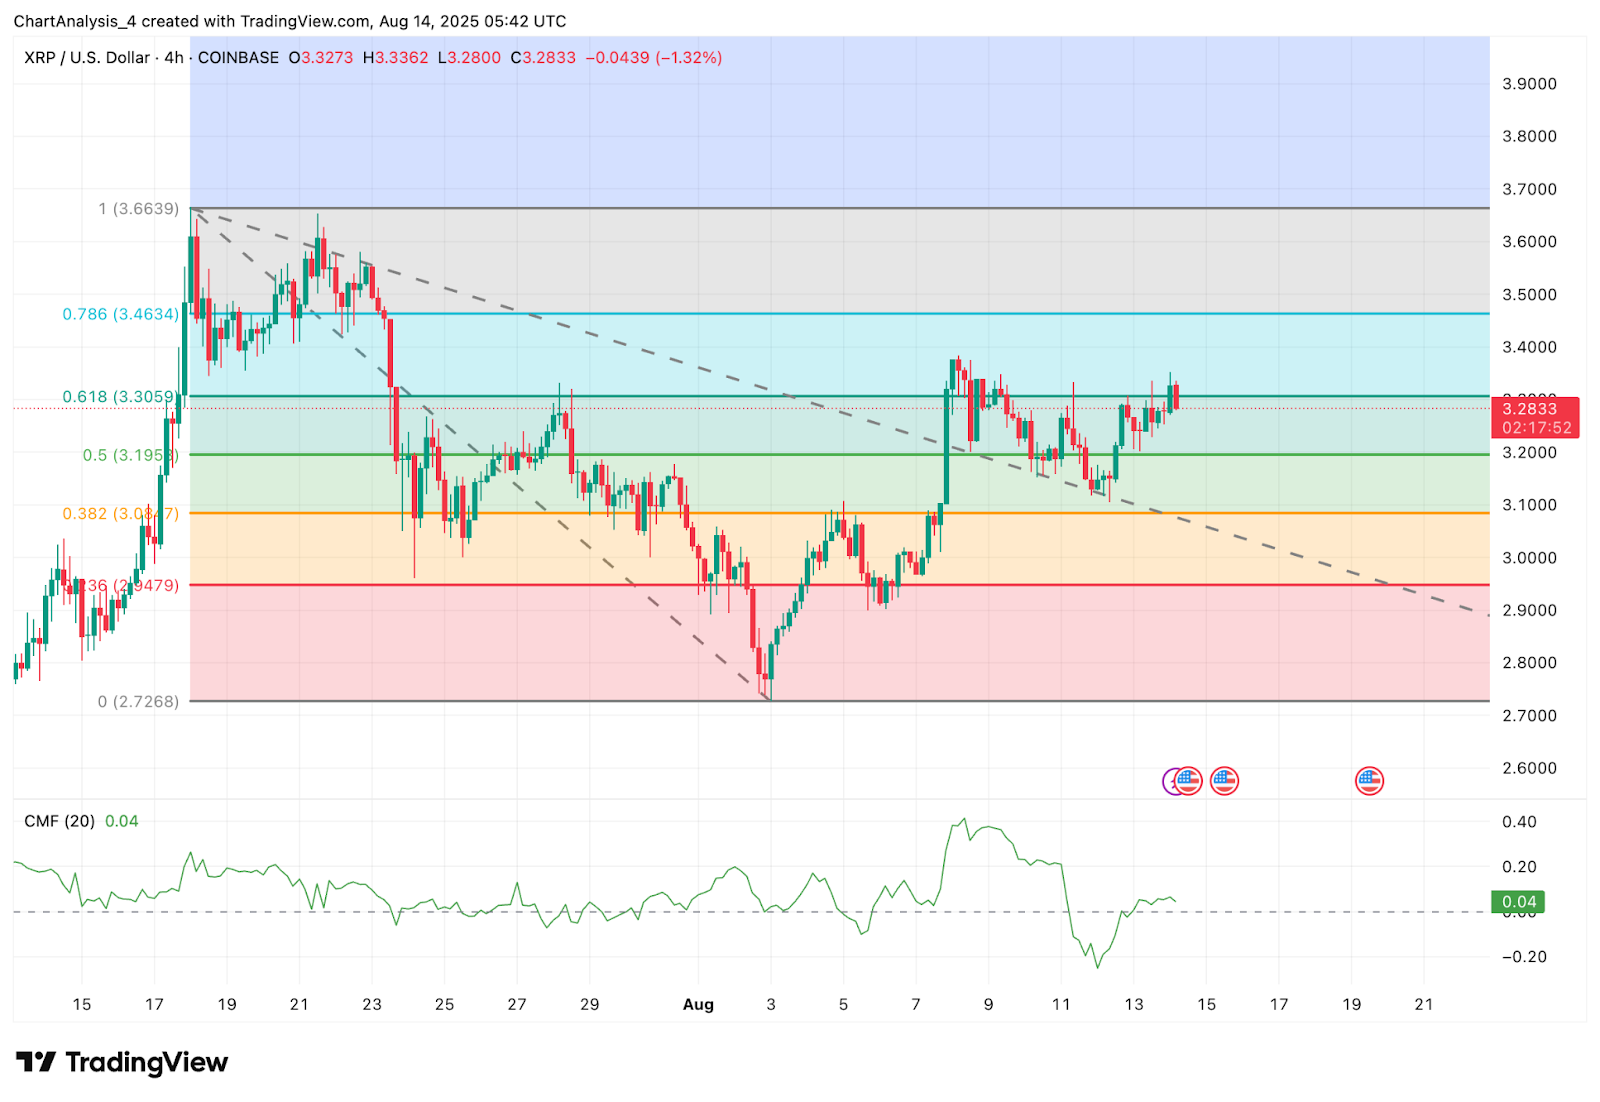
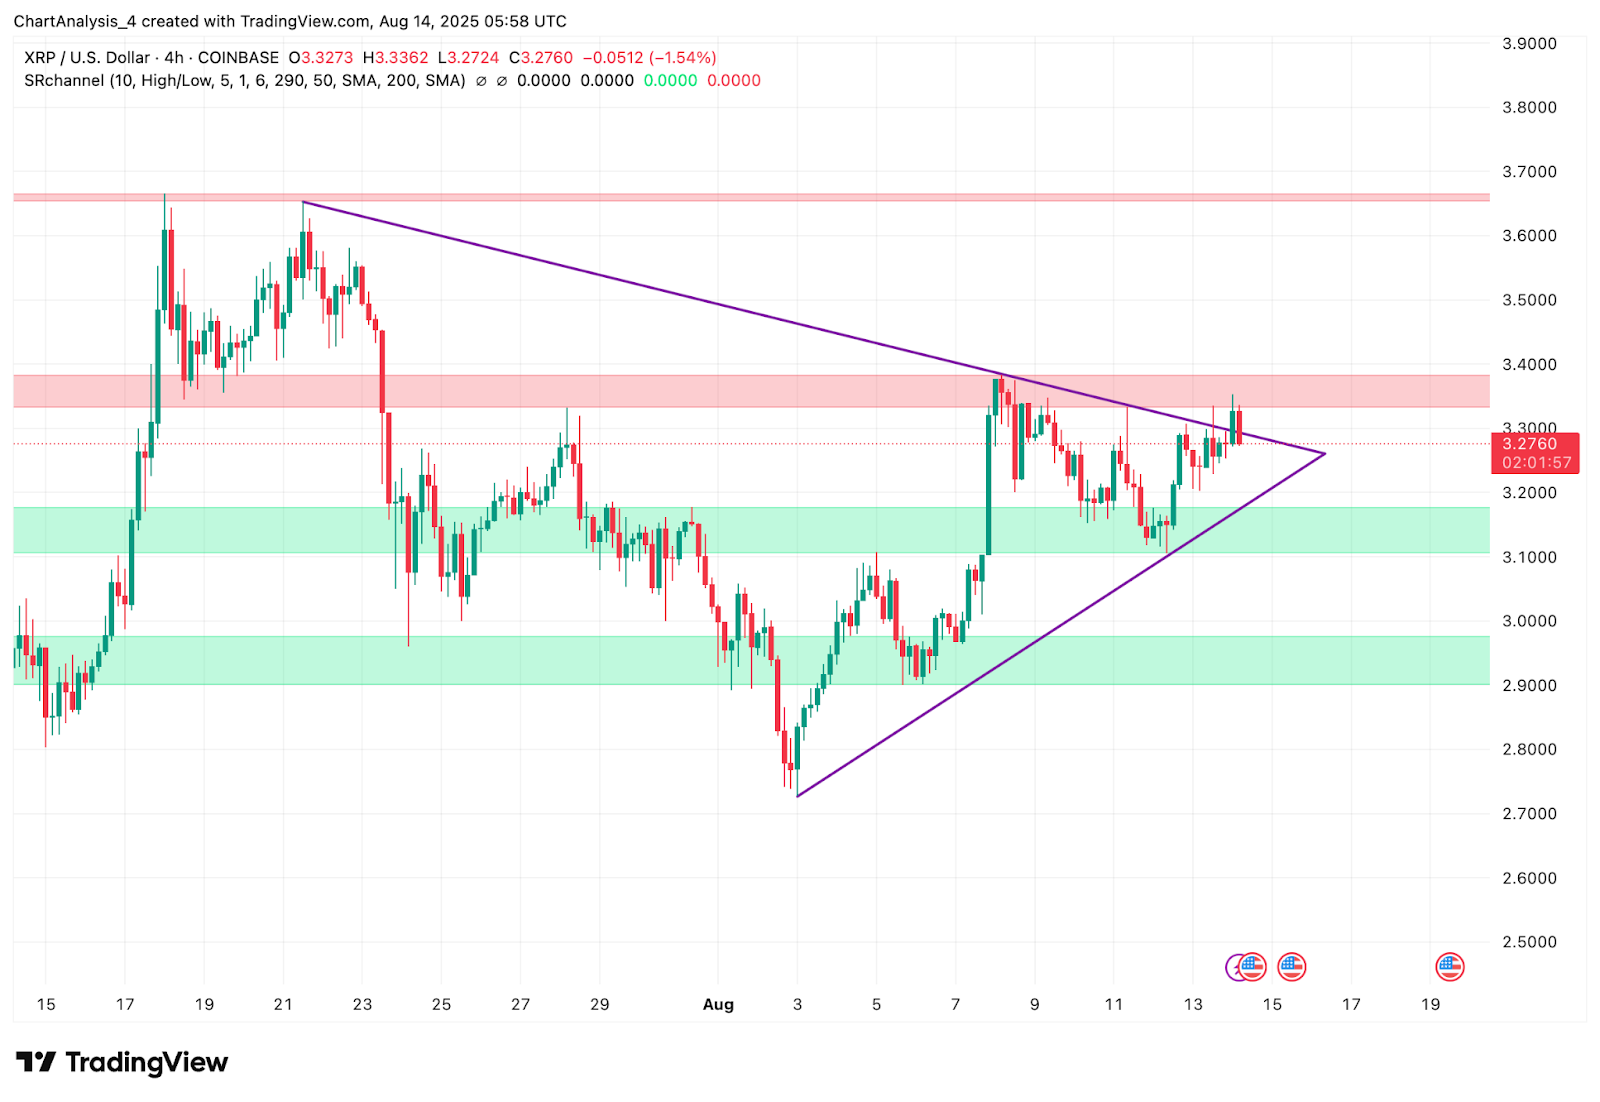
The symmetrical triangle visible on the price chart has its base support near $3.20 and resistance near $3.34. Price is coiling toward the apex, suggesting a directional move is approaching. Above $3.34, immediate resistance emerges at $3.46, with the prior swing high near $3.66 as the next upside target.
Why Is The $XRP Price Going Up Today?
$XRP price dynamics (Source: TradingView)
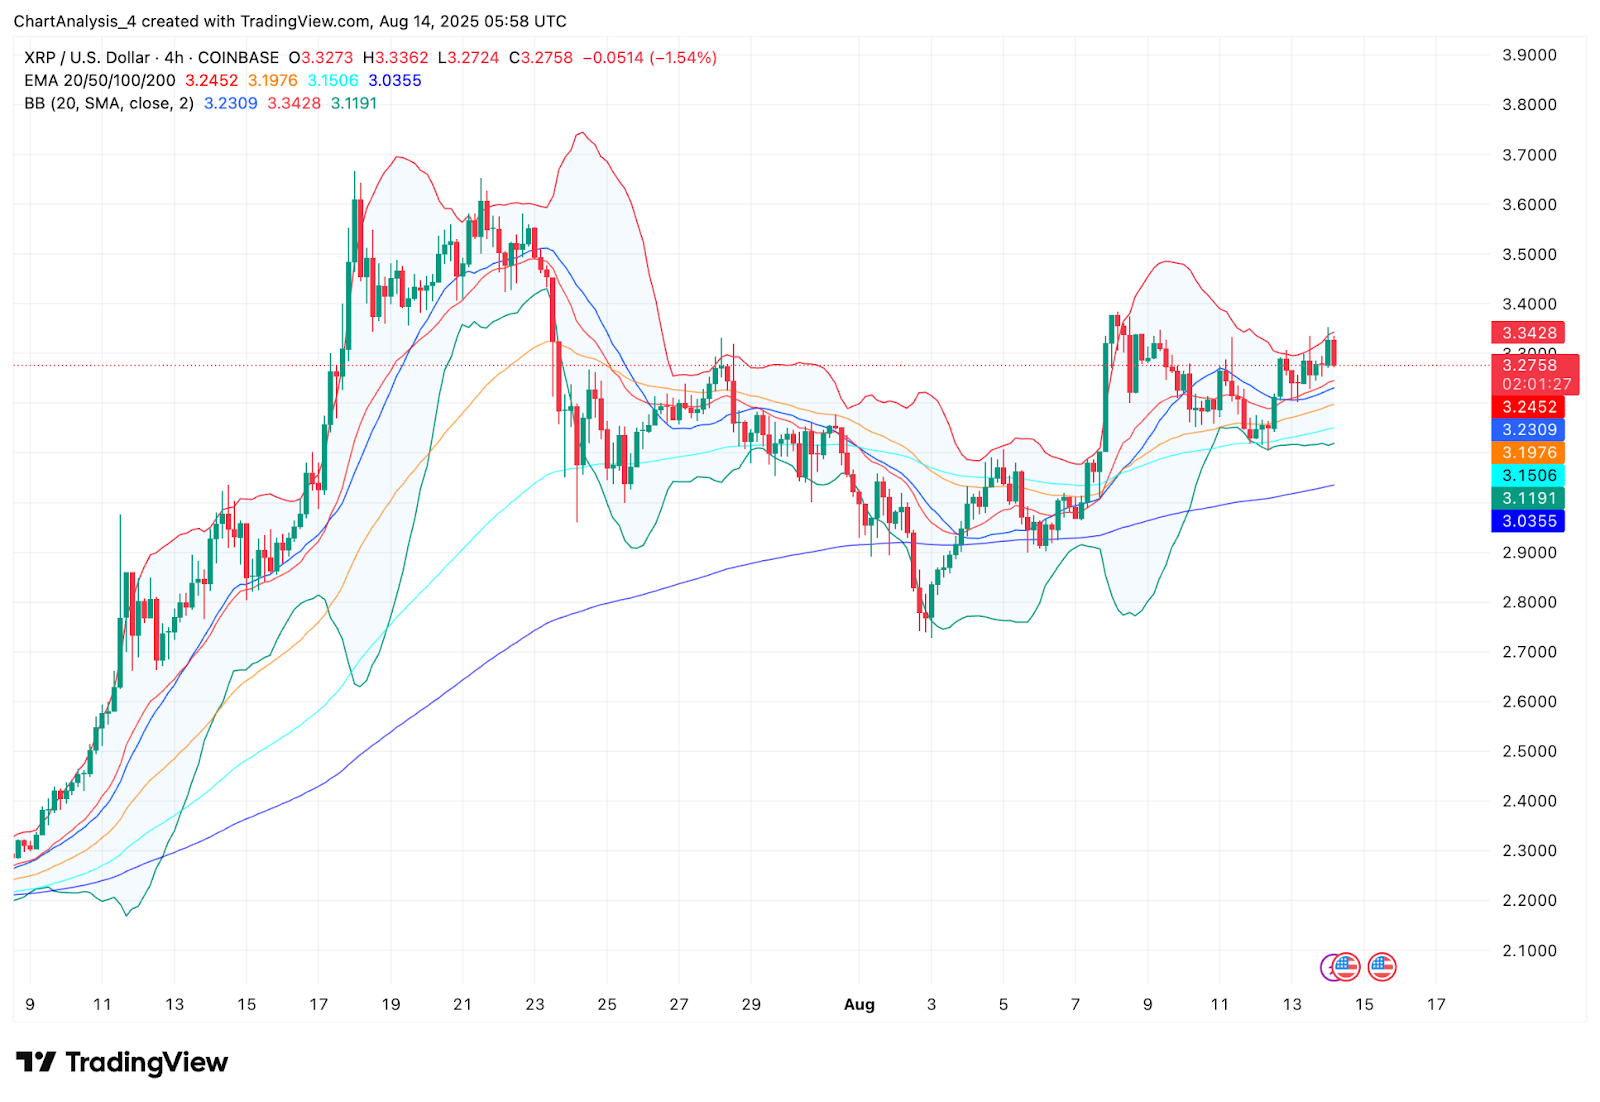
The recent strength in $XRP price stems from a sustained reclaim of intraday EMA levels. The 4-hour EMA cluster shows the 20 EMA at $3.24, 50 EMA at $3.19, 100 EMA at $3.15, and 200 EMA at $3.03, all stacked in bullish alignment. Bollinger Bands indicate moderate expansion, with price trading near the upper band at $3.34, reflecting buying pressure.
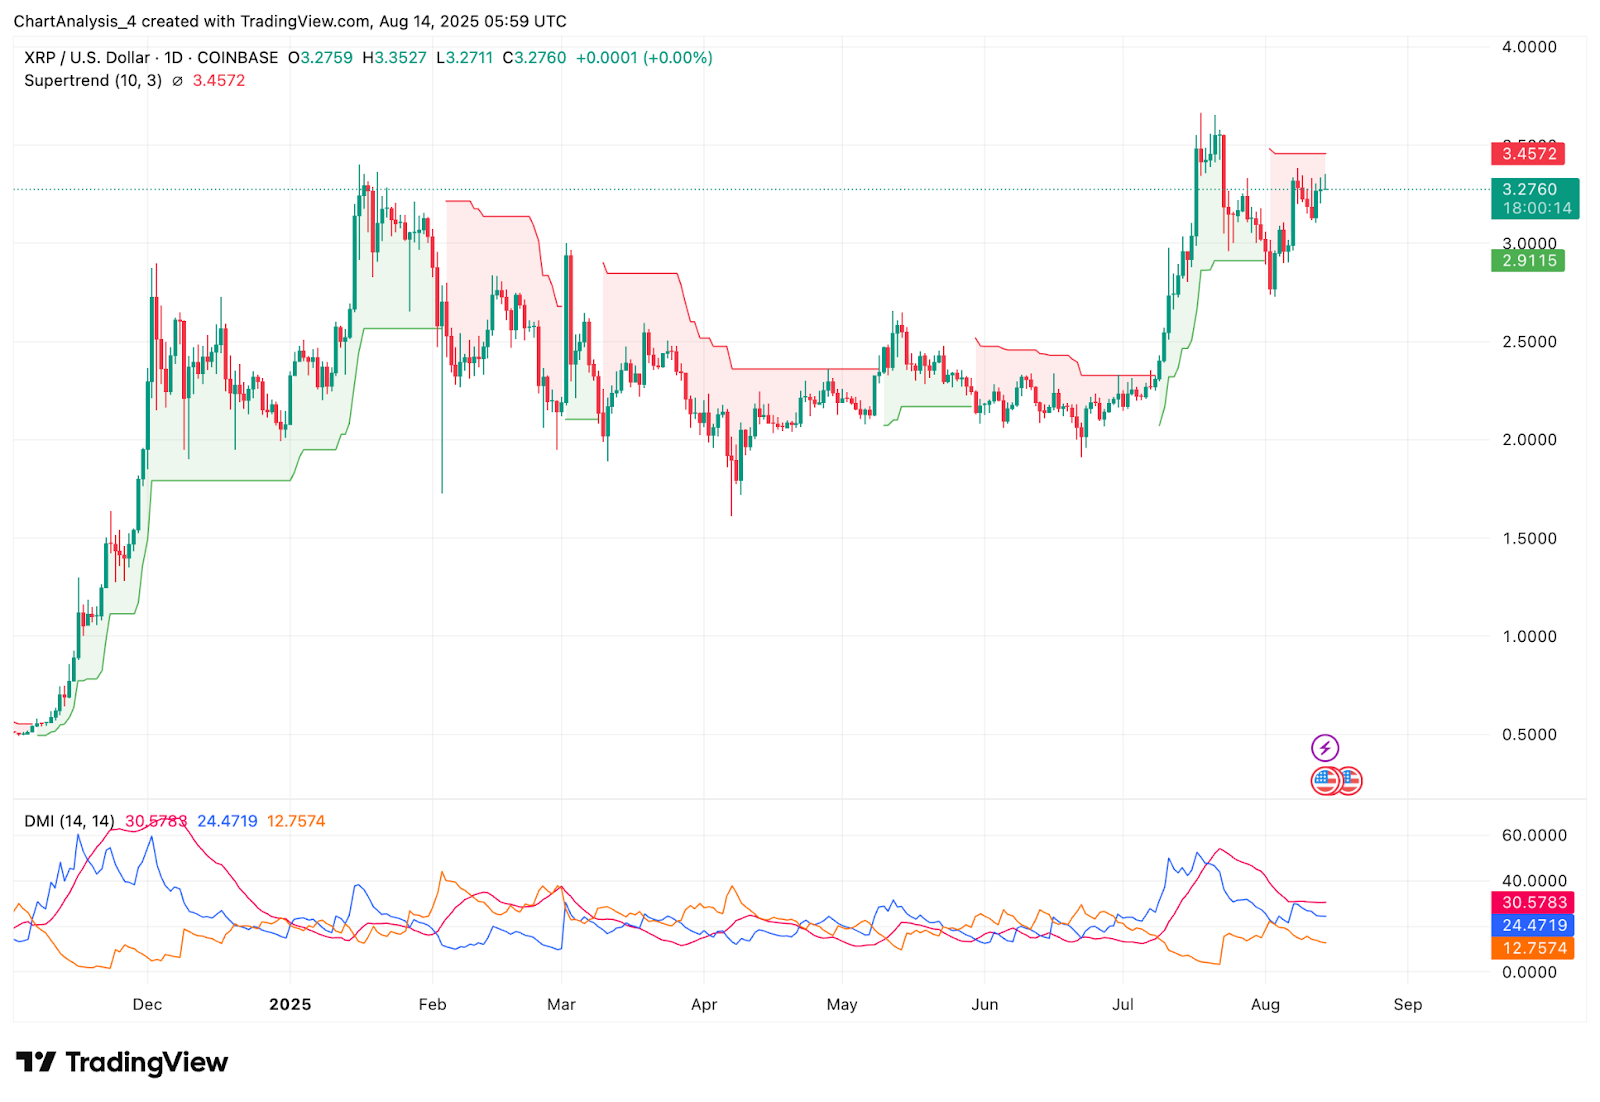
$XRP price dynamics (Source: TradingView)
On the daily chart, the Supertrend remains bullish above $3.45, which aligns with the broader breakout trigger. DMI readings show +DI at 30.57 ahead of -DI at 24.47, with ADX at 12.75, suggesting the trend is still developing but not yet in full momentum mode.
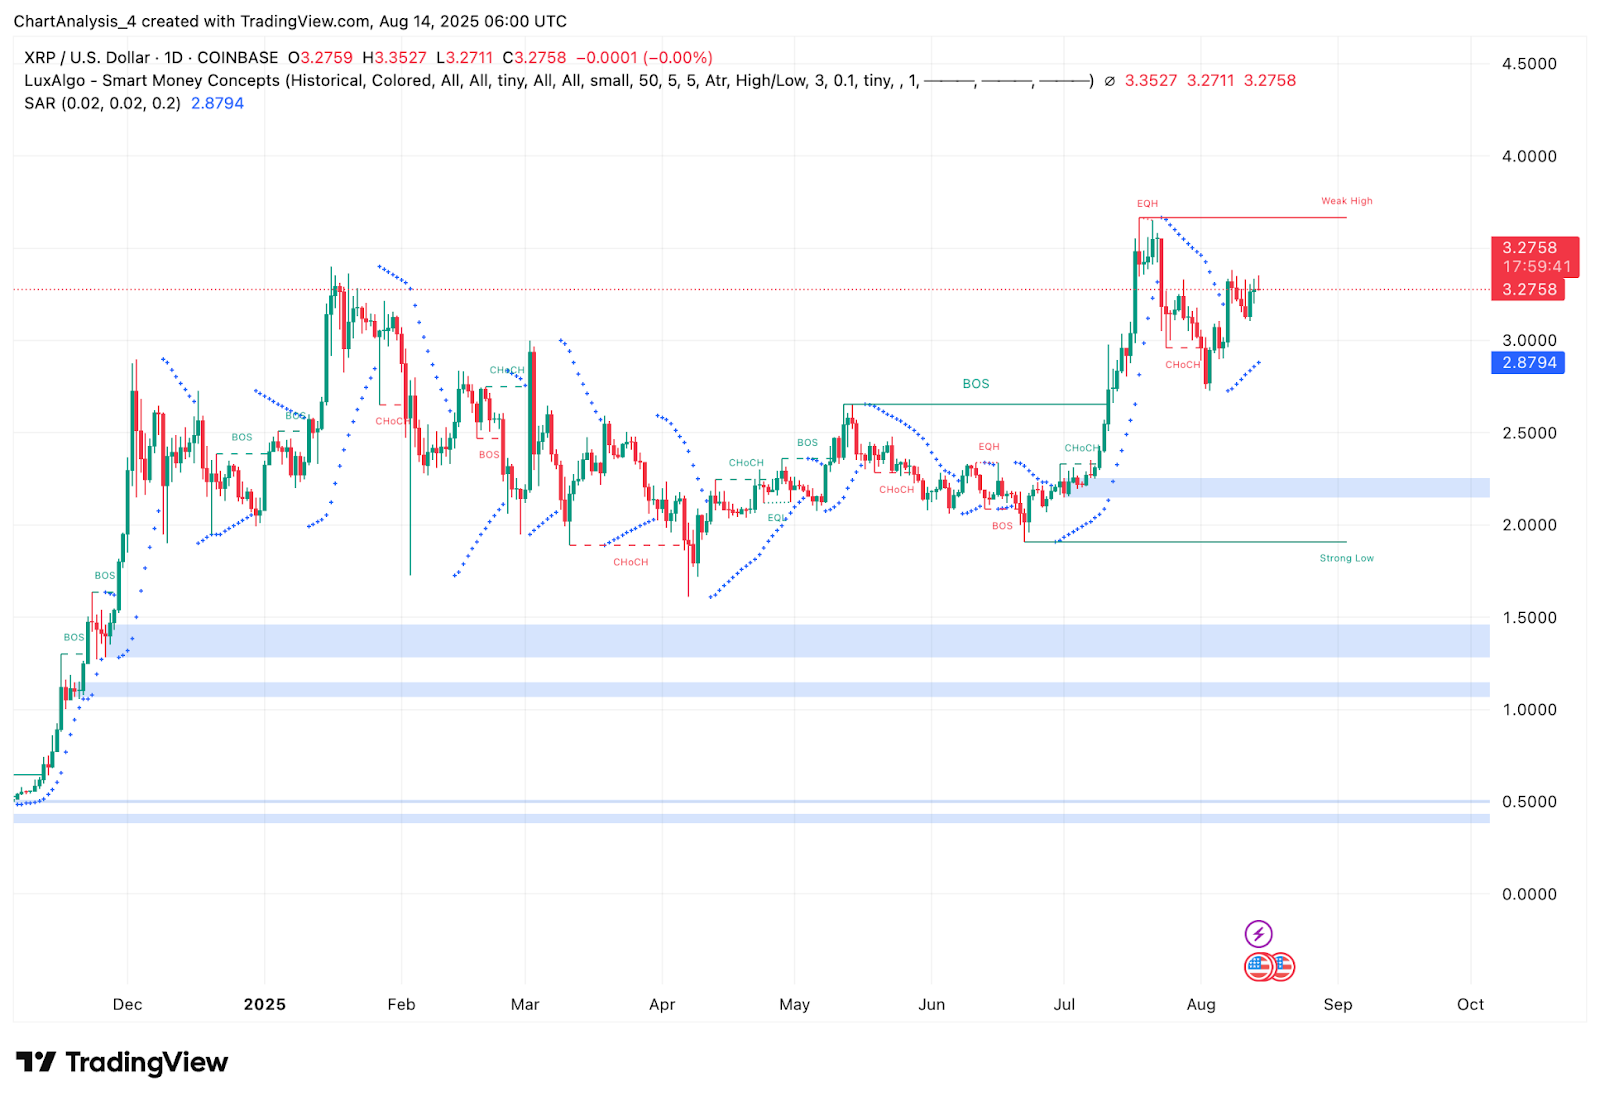
$XRP price dynamics (Source: TradingView)
Smart Money Concepts highlight recent BOS (break of structure) signals, with price holding above a key support block near $2.87. The current move is positioned to challenge a weak high around $3.35–$3.36.
On-Chain Flow and Market Positioning
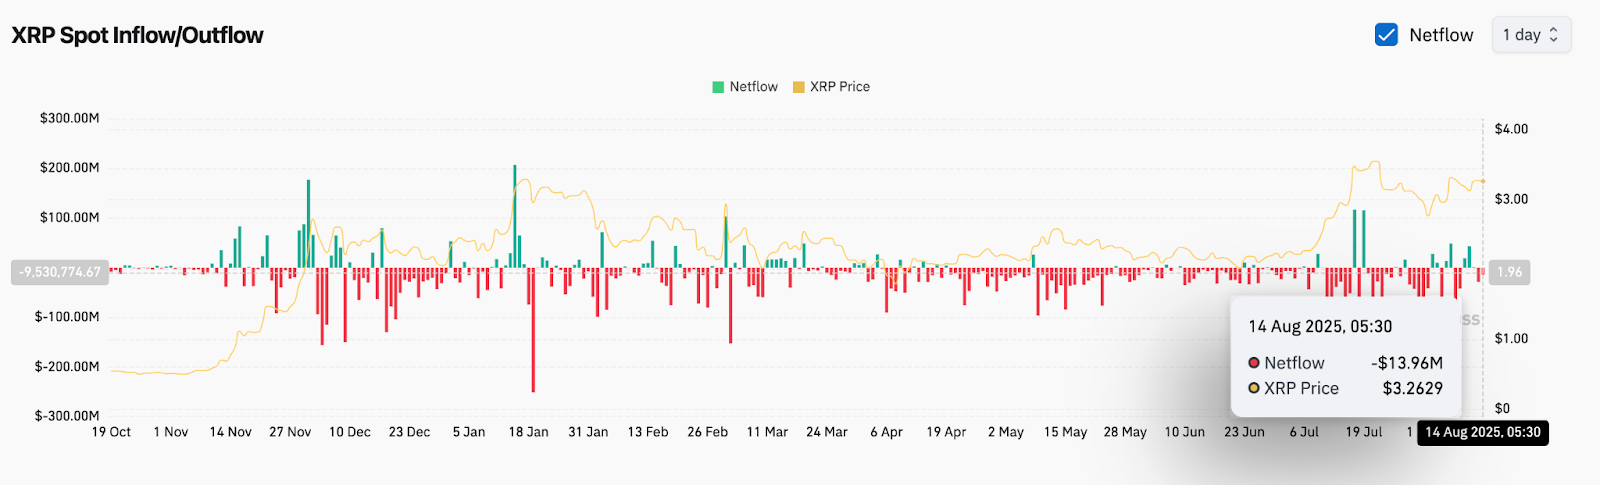
$XRP Spot Inflow/Outflow Data (Source: Coinglass)
Spot netflow data shows a net outflow of -$13.96M on August 14, indicating more tokens moving off exchanges than entering. This supports the bullish case, as reduced exchange supply often precedes upward moves.
Liquidity concentration above $3.34 suggests that a breakout could trigger stop runs toward the $3.46 and $3.66 liquidity pockets. Failure to clear this zone may lead to a pullback toward the $3.20–$3.19 EMA support band.
$XRP Price Action Signals Potential Breakout
Bollinger Bands on the 4-hour chart are starting to widen after a period of compression, which typically precedes a directional expansion. The EMA20 and EMA50 confluence at $3.24–$3.19 provides a critical intraday support base for bulls.
If buyers maintain pressure and close above $3.34, it would confirm the triangle breakout and open room for a rally toward $3.46 and $3.66. A rejection, however, could send price back into the $3.20 range before another attempt.
$XRP Price Prediction: Short-Term Outlook (24h)
In the next 24 hours, $XRP price today will likely focus on the $3.34 resistance. A bullish breakout above this level may aim for $3.46 and $3.66. A failure to hold above $3.30 could see a retest of $3.20, with further weakness potentially targeting $3.03 (200 EMA).
The short-term bias remains bullish above $3.20, but momentum confirmation requires a decisive breakout backed by volume.
$XRP Price Forecast Table: August 15, 2025
Disclaimer: The information presented in this article is for informational and educational purposes only. The article does not constitute financial advice or advice of any kind. Coin Edition is not responsible for any losses incurred as a result of the utilization of content, products, or services mentioned. Readers are advised to exercise caution before taking any action related to the company.

 coinedition.com