
$XRP’s price action is sending mixed signals. While short-term gains have appeared, the bigger picture on the weekly chart still leans towards weakness in the coming months.On the weekly timeframe, $XRP has a confirmed bearish divergence, a technical sign that momentum is slowing. This usually points to a possible pullback ahead.
While short-term rallies can happen, the overall trend hints at a slowdown or even a deeper correction. Analysts believe that from late August into September and October, $XRP could face more bearish price action, similar to other coins with the same chart pattern.
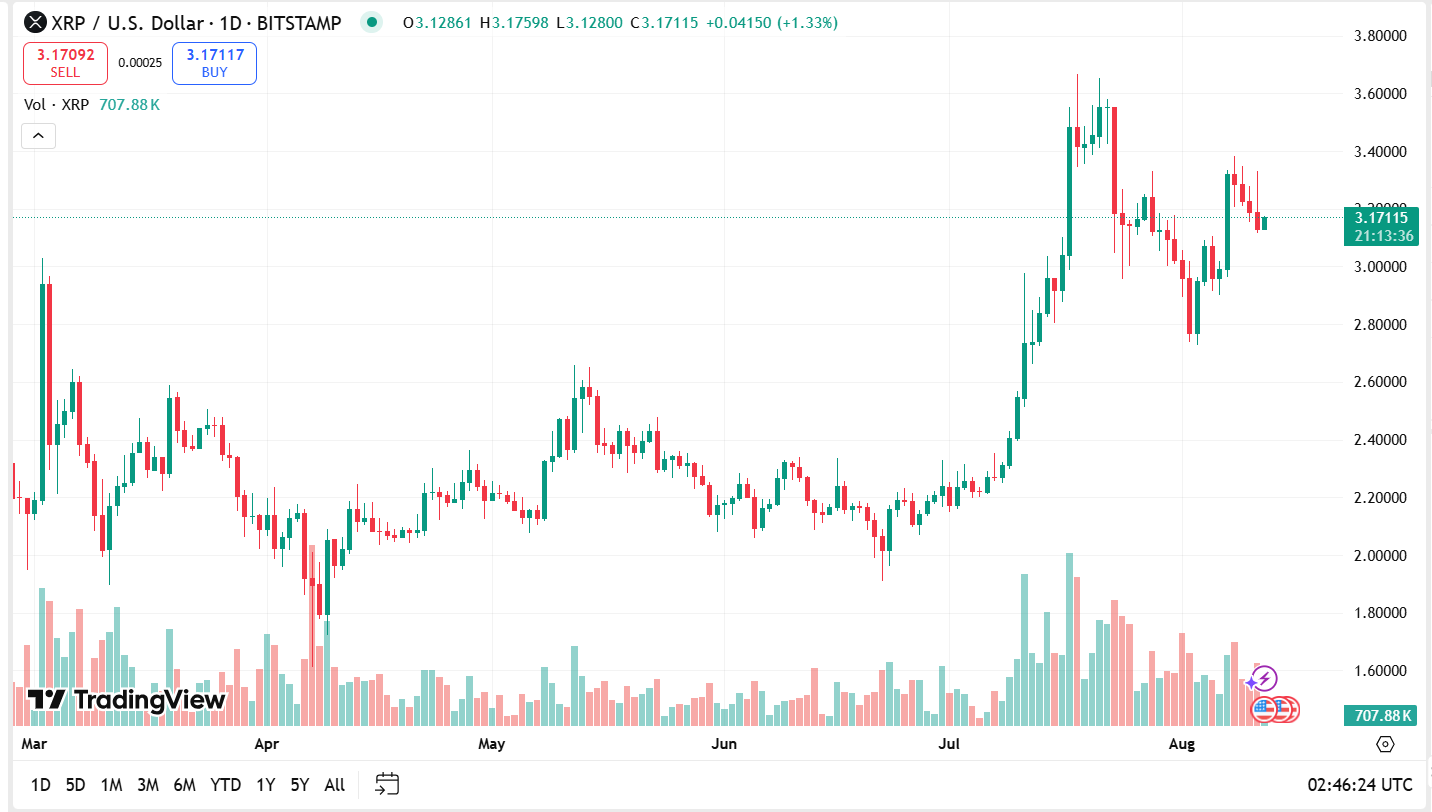
Daily Chart Shows Temporary Strength
Looking at the daily chart, $XRP has enjoyed a strong bounce over the past week. However, this appears to be a short-lived rally within a larger bearish price structure.
The setup is similar to what happened earlier this year in January and February, when $XRP rose sharply for a while but ultimately moved lower overall.
Support Levels to Watch
$XRP is currently testing important support in the $3.10 to $3.15 range. If this level fails, the next support lies near $2.90 to $3.00. A daily close below $2.90 could pave the way for a deeper drop toward $2.75. Below that, the $2.55 to $2.62 zone becomes a critical long-term support area.
Resistance Remains Strong
On the upside, $XRP continues to face tough resistance around $3.35 to $3.40. Over the last few days, this zone has repeatedly pushed the price back, making it a key barrier for any bullish breakout attempt.
Outlook for the Months Ahead
While $XRP can still produce short-term rallies, the larger trend remains a bit shaky. Without a decisive break above key resistance, the risk of further downside remains. For now, if the $3.10 support can hold, as it may determine the coin’s next major move.