
The price of Fetch.ai ($FET) has slipped below its critical 100-day Simple Moving Average (SMA), raising concerns about the potential for further downside toward the next support level at $1. This breach marks a pivotal moment for the asset, opening the door for negative pressure to take hold. As $FET navigates this crucial phase, market participants are closely monitoring its ability to recover above the SMA or risk deeper declines.
$FET’s recent slip below the 100-day SMA, a significant technical indicator, and its implications for future price movements will be analyzed in this article. It will also explore whether this breach signals a continuation of bearish momentum or a possible recovery, providing insights into key levels and scenarios to watch in the coming days.
Analyzing Bearish Momentum: Is A Deeper Decline Likely For $FET?
$FET has fallen below the 100-day SMA on the 4-hour chart, signaling downbeat strength as the price approaches the $1 support zone. This breakdown indicates reduced buyer interest, giving bears control of the market. Holding at $1 could trigger a reversal, while a breach below may lead to more declines toward lower support levels.
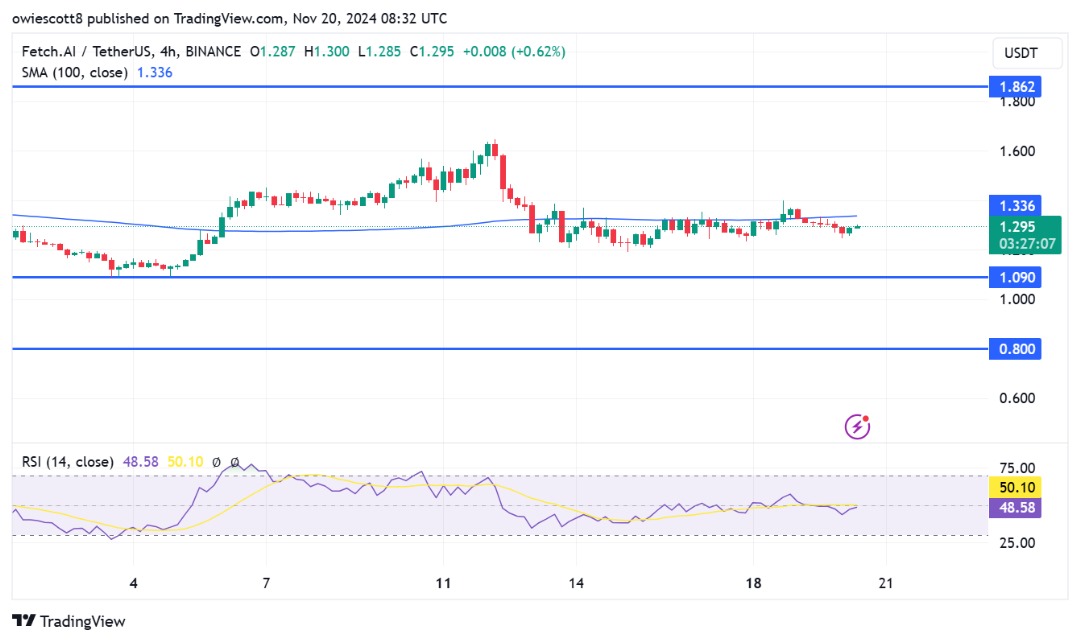
Also, the 4-hour Relative Strength Index (RSI) has fallen below the critical 50% level, currently at 44%, indicating a shift toward bearish sentiment and growing selling pressure as $FET struggles to regain upward momentum. With the RSI under 50%, sellers are taking control, and if the RSI fails to recover above this threshold, the pessimistic trend may continue. Traders should watch for any signs of a reversal or if the price remains under pressure, potentially leading to further drops.
On the daily chart, $FET is showing strong negative strength, highlighted by a bearish candlestick pattern that has pushed the price below the 100-day SMA. This pattern implies that sellers are firmly in control of the market, relentlessly driving the price lower and prompting a strong likelihood of additional drops in the near term.
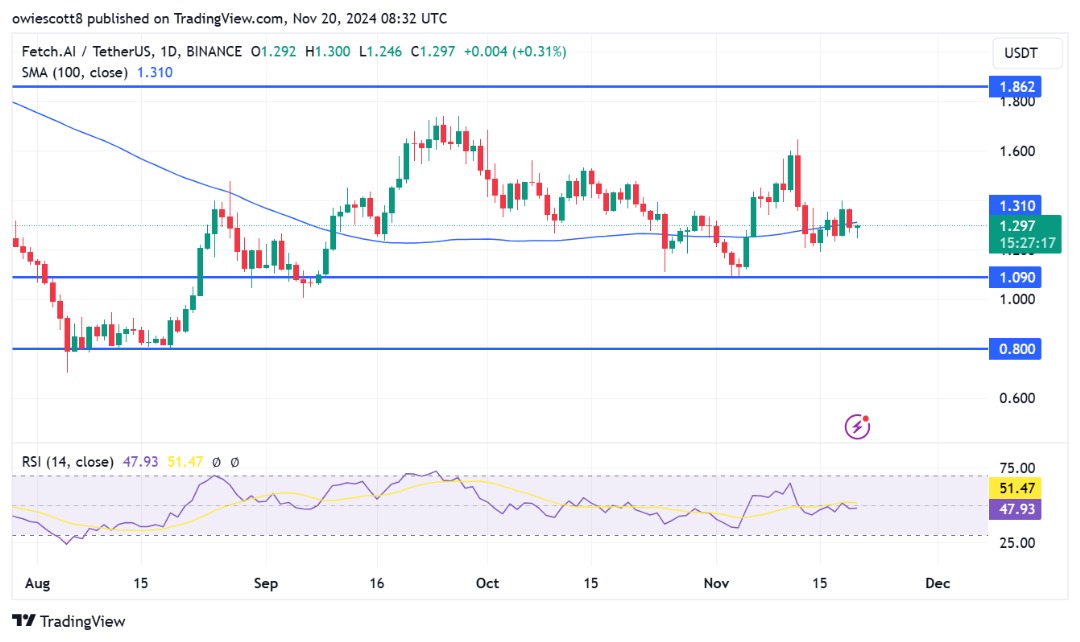
Finally, the 1-day RSI analysis suggests that $FET may face extended losses, as it remains below the 50% threshold, reflecting a continued bearish trend. With selling pressure likely dominating, the chances of further declines are high. A recovery above the 50% level could signal a potential reversal, but $FET continues to struggle to regain an upward momentum for now.
Navigating Risks And Opportunities In $FET’s Price Action
Navigating the risks and opportunities in $FET’s price action requires a careful assessment of key technical indicators and market sentiment. As $FET trades below its 100-day SMA and the 4-hour RSI drops below the 50% threshold, bearish momentum is gaining traction, which could signal more downside toward the $1 support range.
However, opportunities for a reversal may arise if the asset manages to hold above key support levels or if buying pressure resurges, driving the RSI back above 50% and reclaiming the 100-day SMA. Meanwhile, this could pave the way for a potential move toward the $1.8 resistance level.