$XRP market sentiment heats up as an analyst identifies a major bullish signal that hints at a potential breakout in the near term toward a double figure.
The analyst, Javon Marks, pointed out in his latest analysis that the current $XRP setup is similar to a price action structure from 2017, where $XRP consolidated for over two years in a horizontal range between $0.004 and $0.009.
$XRP Bullish Setup
Interestingly, this phase featured hidden bullish divergence, which indicates underlying strength in a market despite relatively stable prices. In early 2017, following the divergence, $XRP experienced a major breakout, surging from its consolidation range to the $3.31 peak.
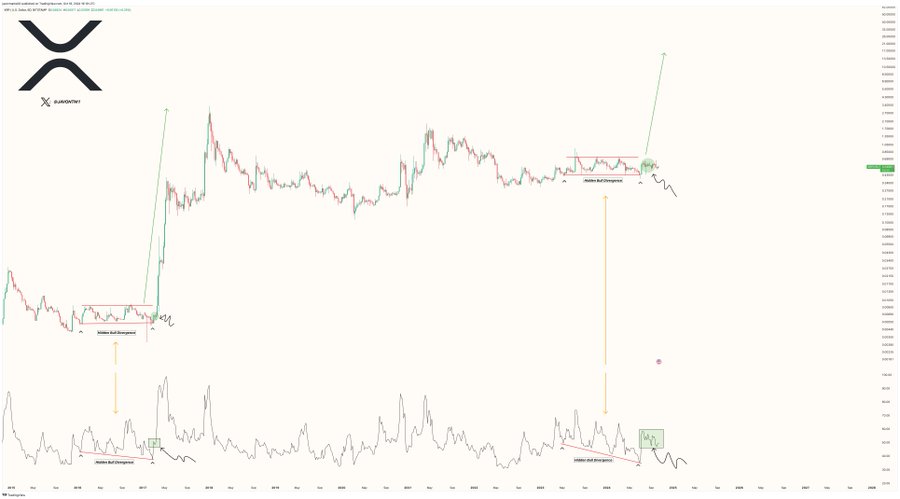
Now, in 2024, $XRP is again displaying signs of strength. The analyst’s chart shows that since May 2023, $XRP has been trading in a similar rectangular consolidation zone between $0.42 and $0.74.
This range has also featured a hidden bullish divergence, similar to the pattern observed in 2017. The analyst believes that this could signal another explosive breakout. The analyst also spotlighted a consolidation area marked in a green circle within the chart, which occurred just before $XRP’s breakout in 2017.
This consolidation area is now playing out in 2024 as $XRP forms another structure. The appearance of this structure could mean that $XRP is now building up strength for the breakout. Despite not presenting a definite target, Marks’ chart depiction suggests a rally toward $17.
At its current price, $XRP would need to rally 3,029% to clinch the $17 target. Notably, other analysts have also predicted a rally to this price level, with EGRAG, one such individual, citing what he calls the “Bent Fork” as a potential trigger.
$XRP Current Position
On the daily chart, $XRP is now showing signs of recovery. At the time of writing, $XRP is trading at $0.5433, having bounced back from a steep decline at the end of September.
Between Sept. 30 and Oct. 3, the altcoin experienced a short-term collapse on the back of the SEC’s appeal notice but managed to stabilize and form a symmetrical triangle.
The chart shows that $XRP is currently testing the 0.236 Fibonacci retracement level, which sits at $0.5443. For a breakout from the symmetrical triangle to materialize, $XRP would need to decisively close above the 0.382 Fibonacci level at $0.5674.
If this happens, it could trigger a wave of buying interest, leading to a sustained move higher. The next major resistance level would be the 0.618 Fibonacci level at $0.6049, which would further confirm the bullish momentum.
Meanwhile, the Relative Strength Index (RSI) is currently at 46.63, a neutral reading. However, RSI values above 50 indicate bullish momentum. Given that $XRP is trading just below the 50 mark, a slight uptick in price could quickly push the RSI into bullish territory.