SUI price is capturing significant attention in the crypto market with a strong 126% rally from below $1 in late August. Traders and investors are increasingly bullish as the layer-1 blockchain tests crucial supply levels. As the SUI price approaches $2, there is growing speculation that the asset could soon reach a new all-time high (ATH). This article will offer an SUI price analysis for a better understanding of its impressive surge, as well as an SUI price prediction by assessing all bullish patterns.
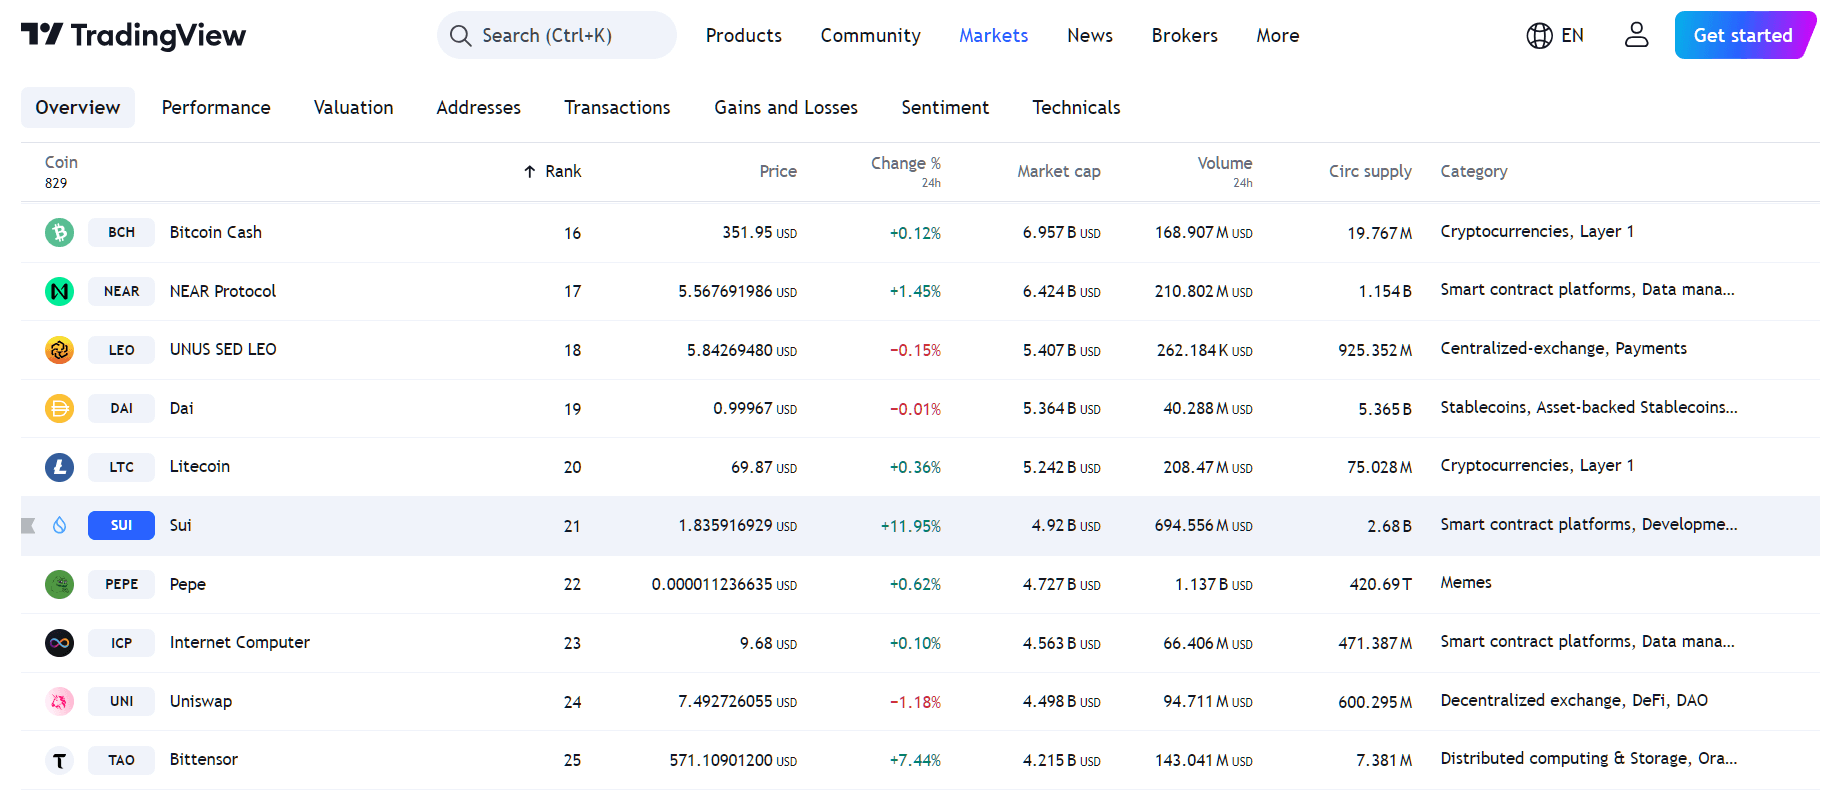
SUI Price Analysis: The Impressive SUI Price Surge
When it comes to SUI price analysis, its impressive performance has made it one of the most trending assets in recent weeks.
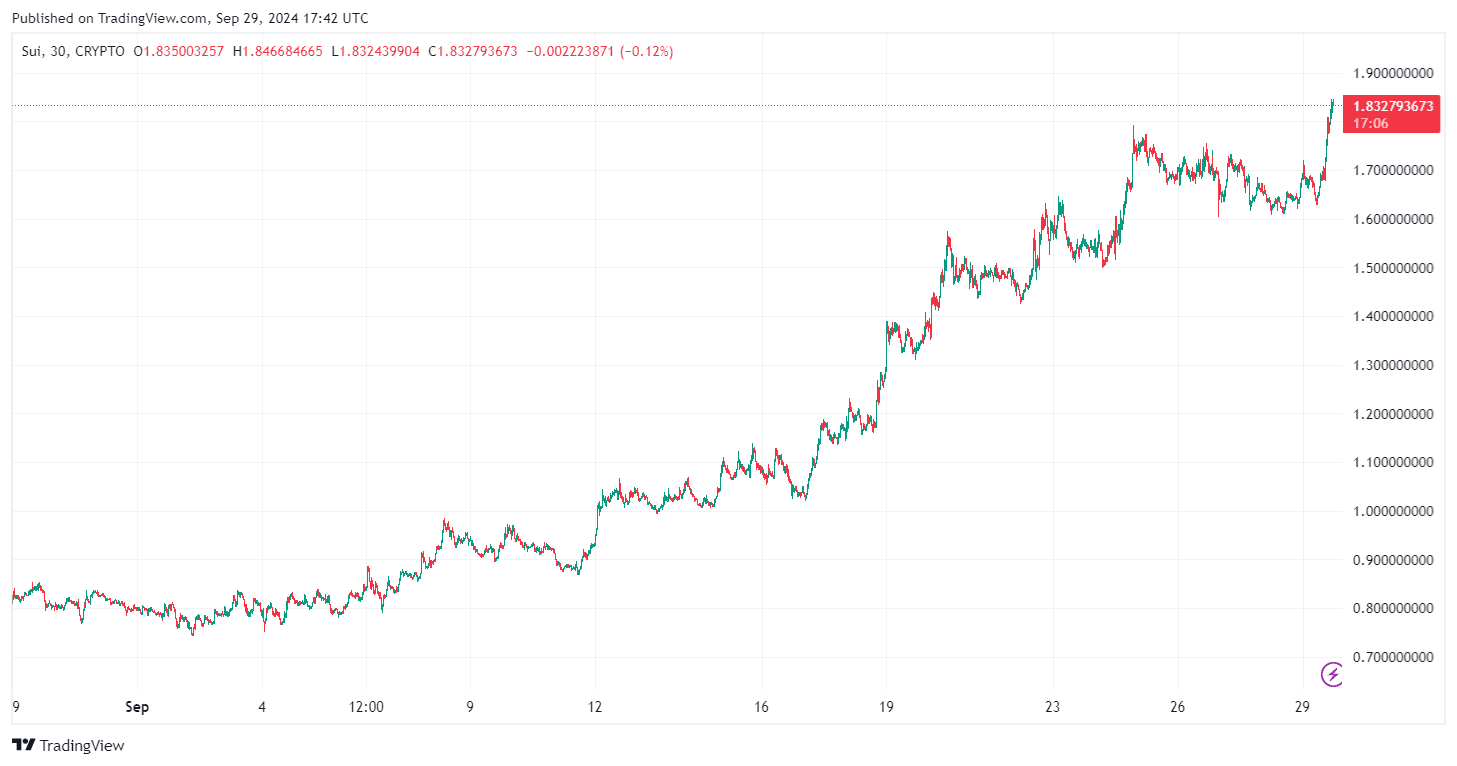
Its strong price action has sparked excitement among traders, with many anticipating further gains in the coming months. Analysts are keeping a close eye on SUI price, especially as it nears its previous ATH of $2.18 back in Mar 27, 2024.
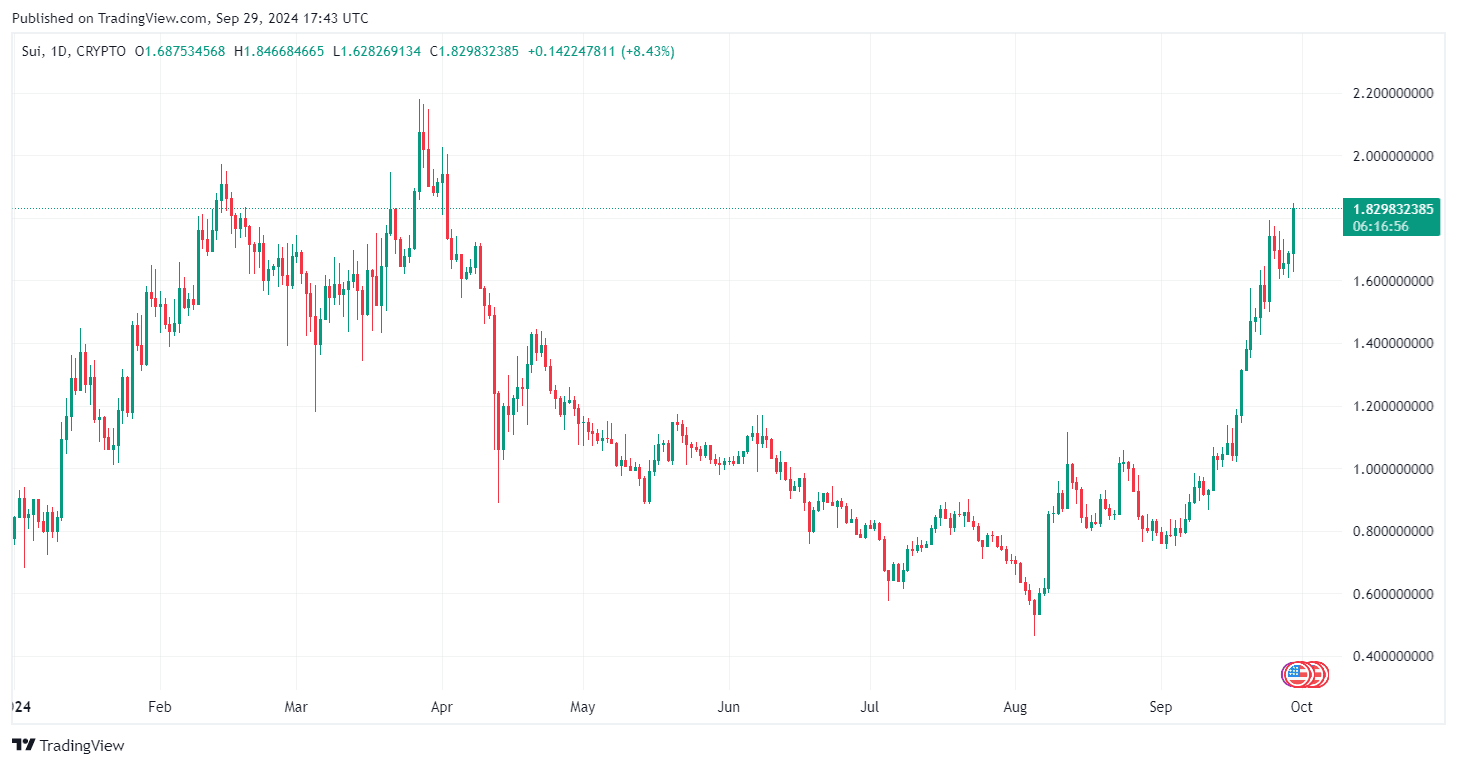
A successful push from SUI price past the $2 mark would solidify its position as a top performer, likely attracting more capital and interest from investors looking for the next big opportunity.
SUI Price Prediction: Bullish Patterns Suggest Further Gains
The optimism around the SUI price has been driven by a bullish inverted head and shoulders pattern, a strong technical indicator. Renowned analysts have highlighted this pattern, so as an SUI price prediction, a breakout above $2 could spark FOMO (fear of missing out) among traders.
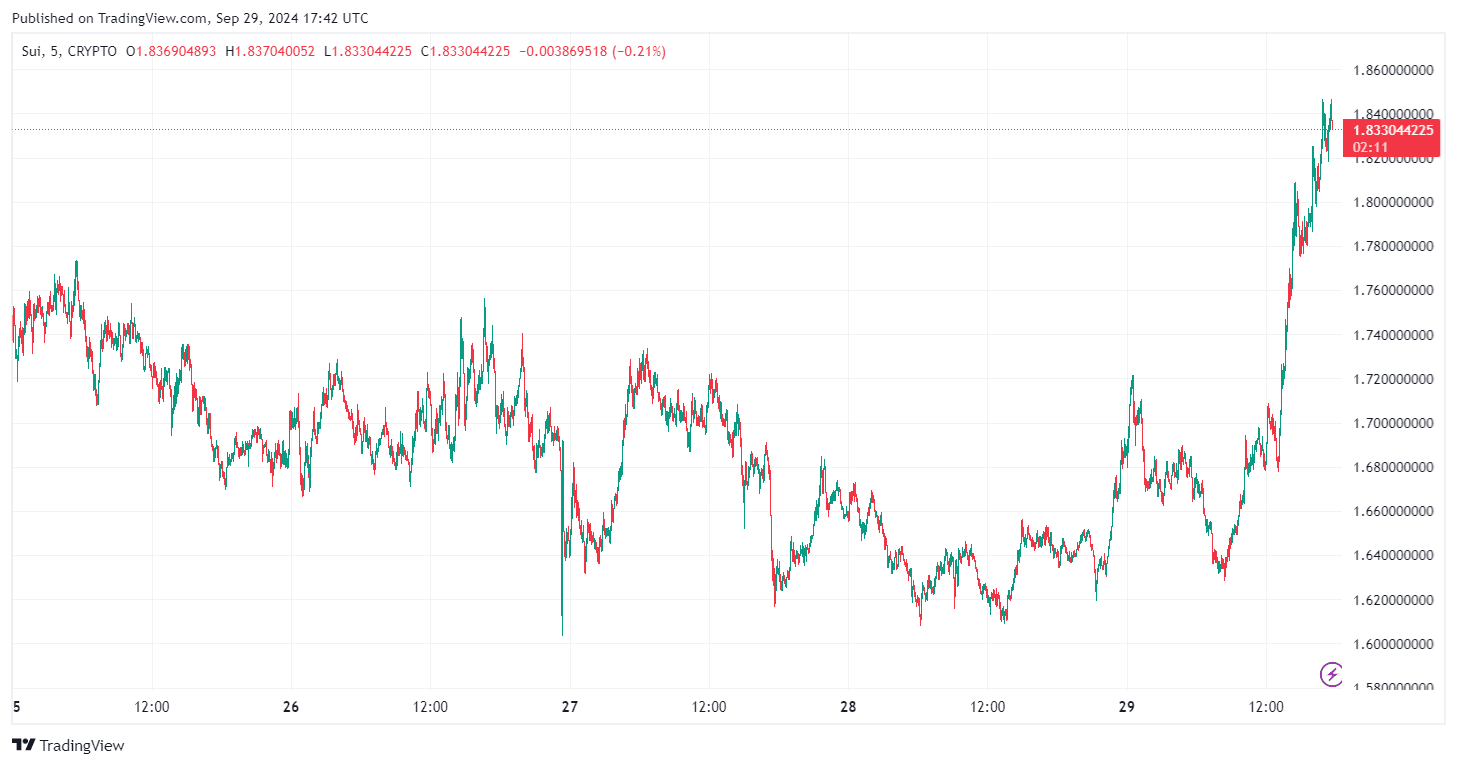
However, broader market conditions and macroeconomic factors will play a significant role in determining more regarding SUI price prediction linked to its current bullish momentum. While the actual setup seems promising, the asset remains sensitive to sudden market shifts. If the SUI price surge continues and manages to break the $2 resistance level, with its same current bullish signals, a new ATH past $2.2 would be highly possible.
SUI Price Levels To Monitor
SUI price is currently trading at $1.84 after a substantial 140% rally from its early September lows of $0.8. The next critical resistance lies at $1.9, a level that traders are closely watching. Breaking this could pave the way for a push toward the ATH of $2.18 and further to a new ATH.
If SUI price fails to break above $1.90, it could retrace to the $1.45 support zone, which was a key resistance in April. This level could present a buying opportunity for traders looking to enter at a lower price.
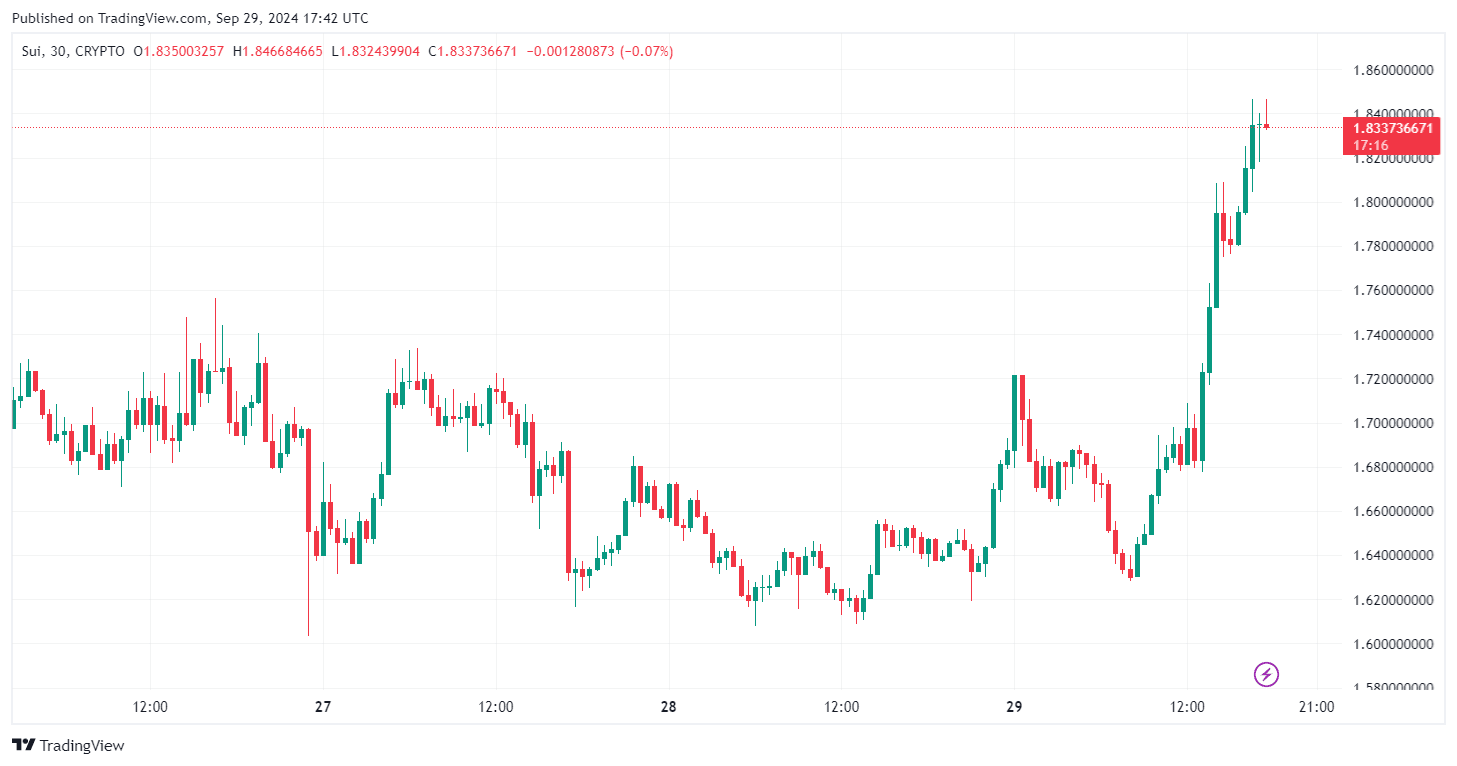
As SUI price continues to test key levels, the next few weeks will be crucial in determining whether it can maintain its upward momentum or face a pullback. For now, all eyes are on its ability to break through the $1.9 barrier at the first level and $2 after that, which will increase the potential for new highs.
 cryptoticker.io
