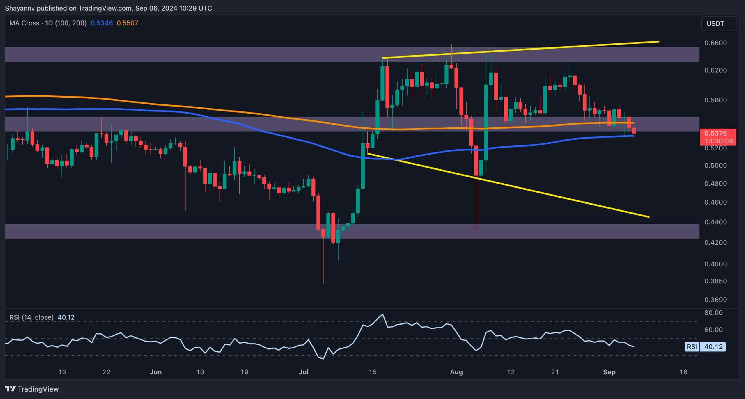
Ripple has presented a solid bearish signal by breaking below the 200-day moving average of $0.55, highlighting the presence of sellers in the market.
However, the price is now battling to breach the 100-day MA at $0.53, and a successful break below this level could trigger a significant decline in the coming days.
XRP Analysis
By Shayan
The Daily Chart
A close analysis of the daily chart reveals that Ripple has been hovering near the critical 200-day moving average at $0.55, and recently, it slipped slightly below this level. Now, the price is at a pivotal support region, defined by the 100-day moving average of $0.53, which acts as a key barrier.
The overall daily outlook will become bearish if Ripple breaks below this level. If buyers defend this zone and hold the price above both daily MAs, there’s a chance for a bullish reversal. However, based on the current price action, a break below $0.53, leading to further decline, seems more likely.

The 4-Hour Chart
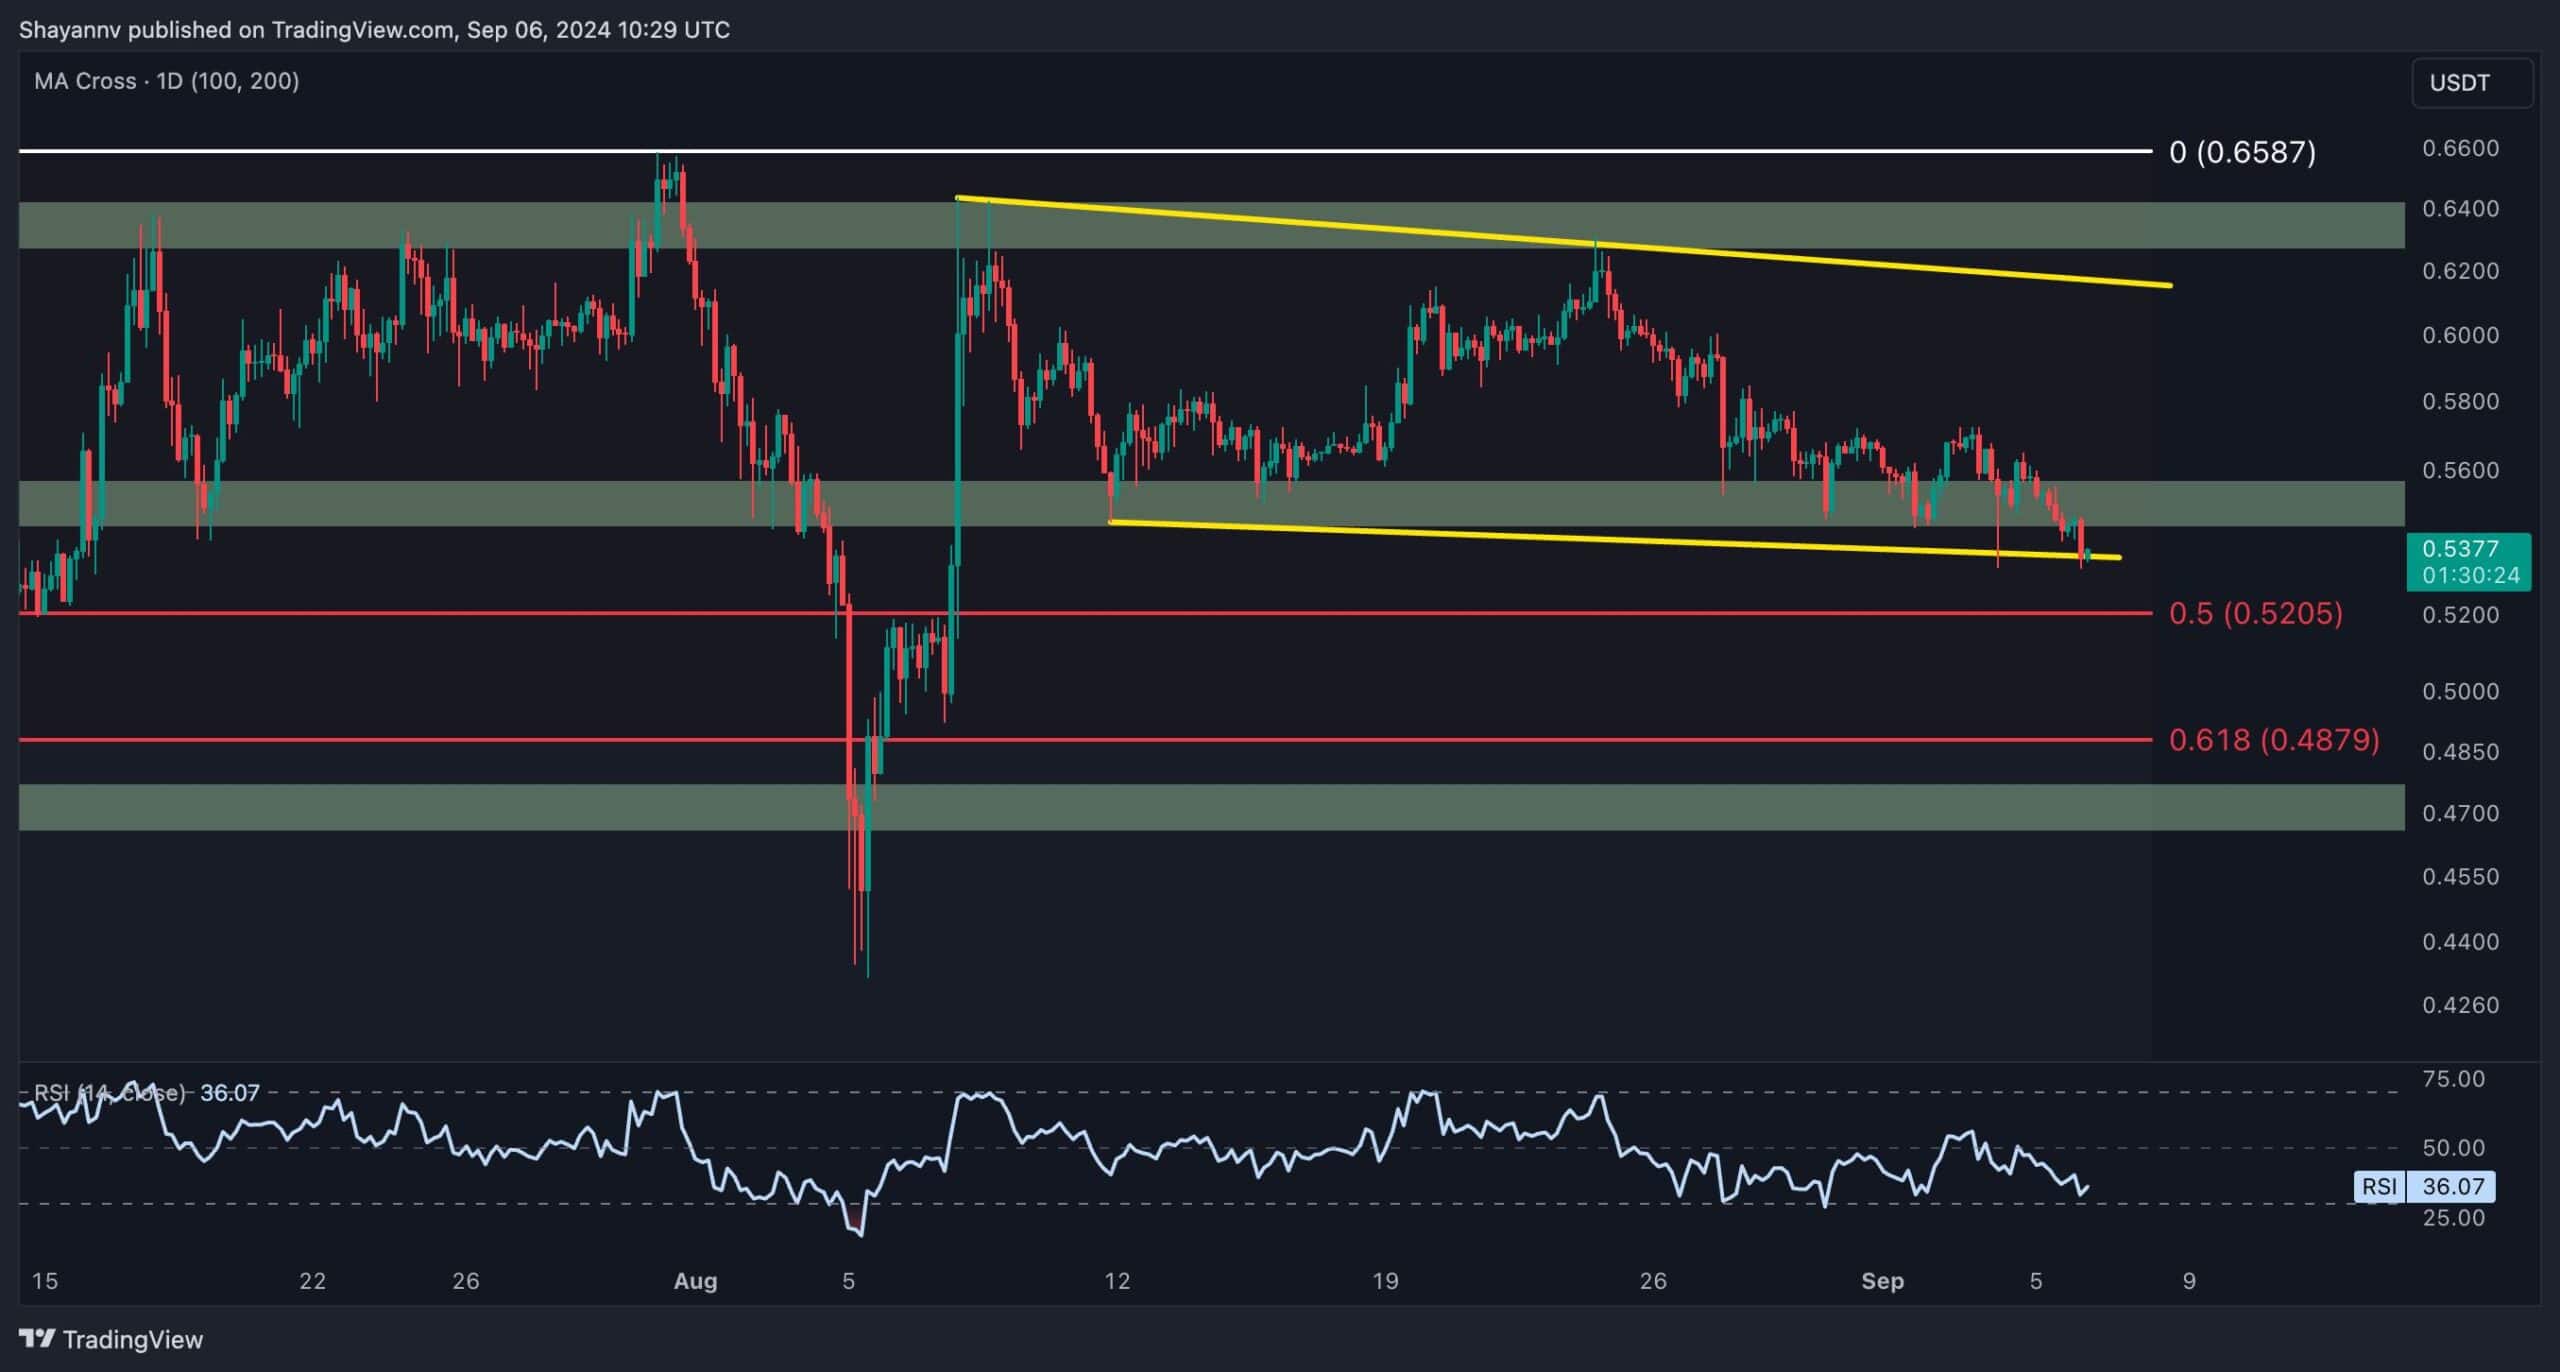
On the 4-hour chart, Ripple remains within a crucial range, with support at $0.53 and resistance around $0.64. The current price action suggests that sellers are increasingly interested in breaking below the $0.53 support zone, which could lead to a significant price drop.
Ripple is currently testing this lower boundary, and a break below it, along with the wedge’s lower boundary, may trigger a liquidation event, pushing the price lower.
In this case, the next downside target lies between the 0.5 and 0.618 Fibonacci retracement levels. Alternatively, if buyers step in and defend the $0.53 level, a rebound toward the $0.60 mark could follow.

 cryptopotato.com