Last week, bullish sentiment dominated the cryptocurrency market, leading to notable price increases across several digital assets. However, the tide appears to be turning for Binance Coin ($BNB), as new sell signals emerge on its chart, suggesting a potential price decline.
$BNB’s Price Set for a Decline?
Data from CoinMarketCap shows that $BNB's price increased by over 6% in the past week. However, the last 24 hours have been bearish, with the coin's chart turning red. At the time of writing, $BNB is trading at $577.01, boasting a market capitalization exceeding $84.2 billion, which secures its position as the fourth-largest cryptocurrency. This recent price dip was not unexpected.
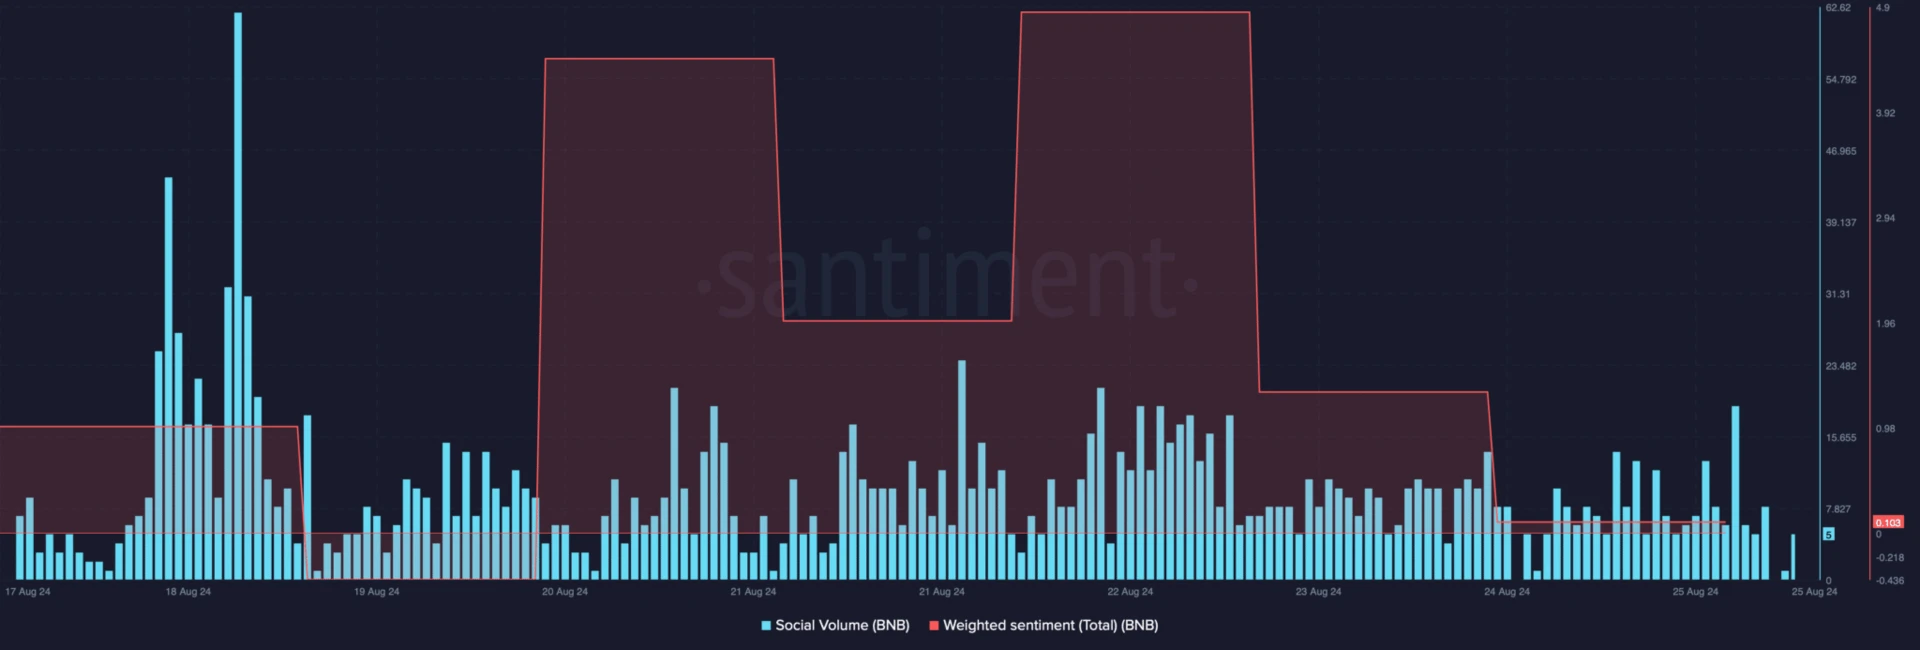
An analysis by Bitcompare, based on Santiment data, indicates that investor confidence in $BNB has been waning over the past few days. This is reflected in the decline of its weighted sentiment and a drop in its social volume, pointing to reduced popularity.
In the midst of this downturn, popular crypto analyst Ali shared a tweet suggesting a continued decline in $BNB's price. According to the tweet, $BNB's TD Sequential indicator has flagged a sell signal.
The TD Sequential presents a sell signal on the $BNB daily chart! pic.twitter.com/68tsJyqD6Q
— Ali (@ali_charts) August 25, 2024
Examining $BNB's Current Market Conditions
Bitcompare’s examination of the coin’s fear and greed index showed a reading of 61% at press time, indicating that the market is currently in a “greed” phase. Historically, when this metric reaches such levels, it often precedes a price correction.
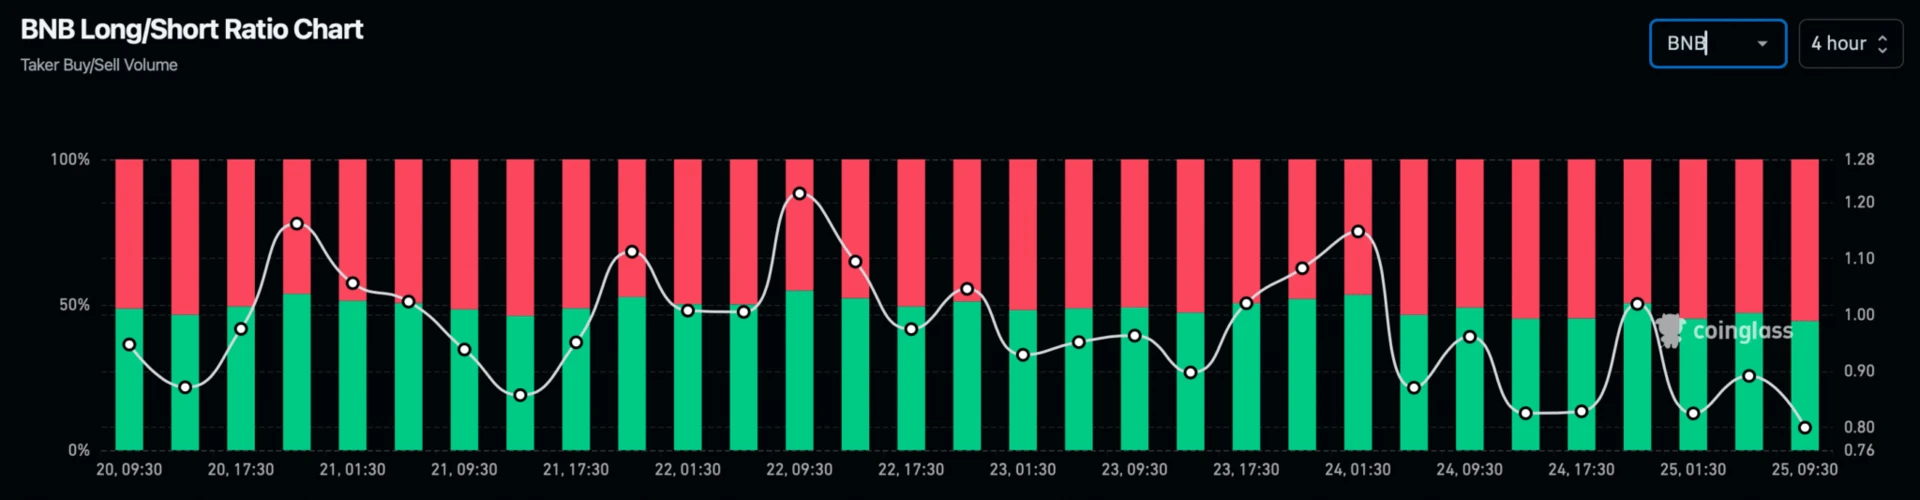
Furthermore, data from Coinglass highlights another bearish indicator. $BNB's long/short ratio has shown a sharp decline, meaning there are now more short positions than long ones in the market. This shift suggests a rise in bearish sentiment surrounding the coin.
Additional insights from Hyblock Capital reveal that $BNB's whale versus retail delta dropped significantly from 61 to 19. This shift suggests that whales, or large holders, are reducing their market exposure. For context, this indicator ranges from -100 to 100, with a value of 0 indicating equal positioning between whales and retail investors.
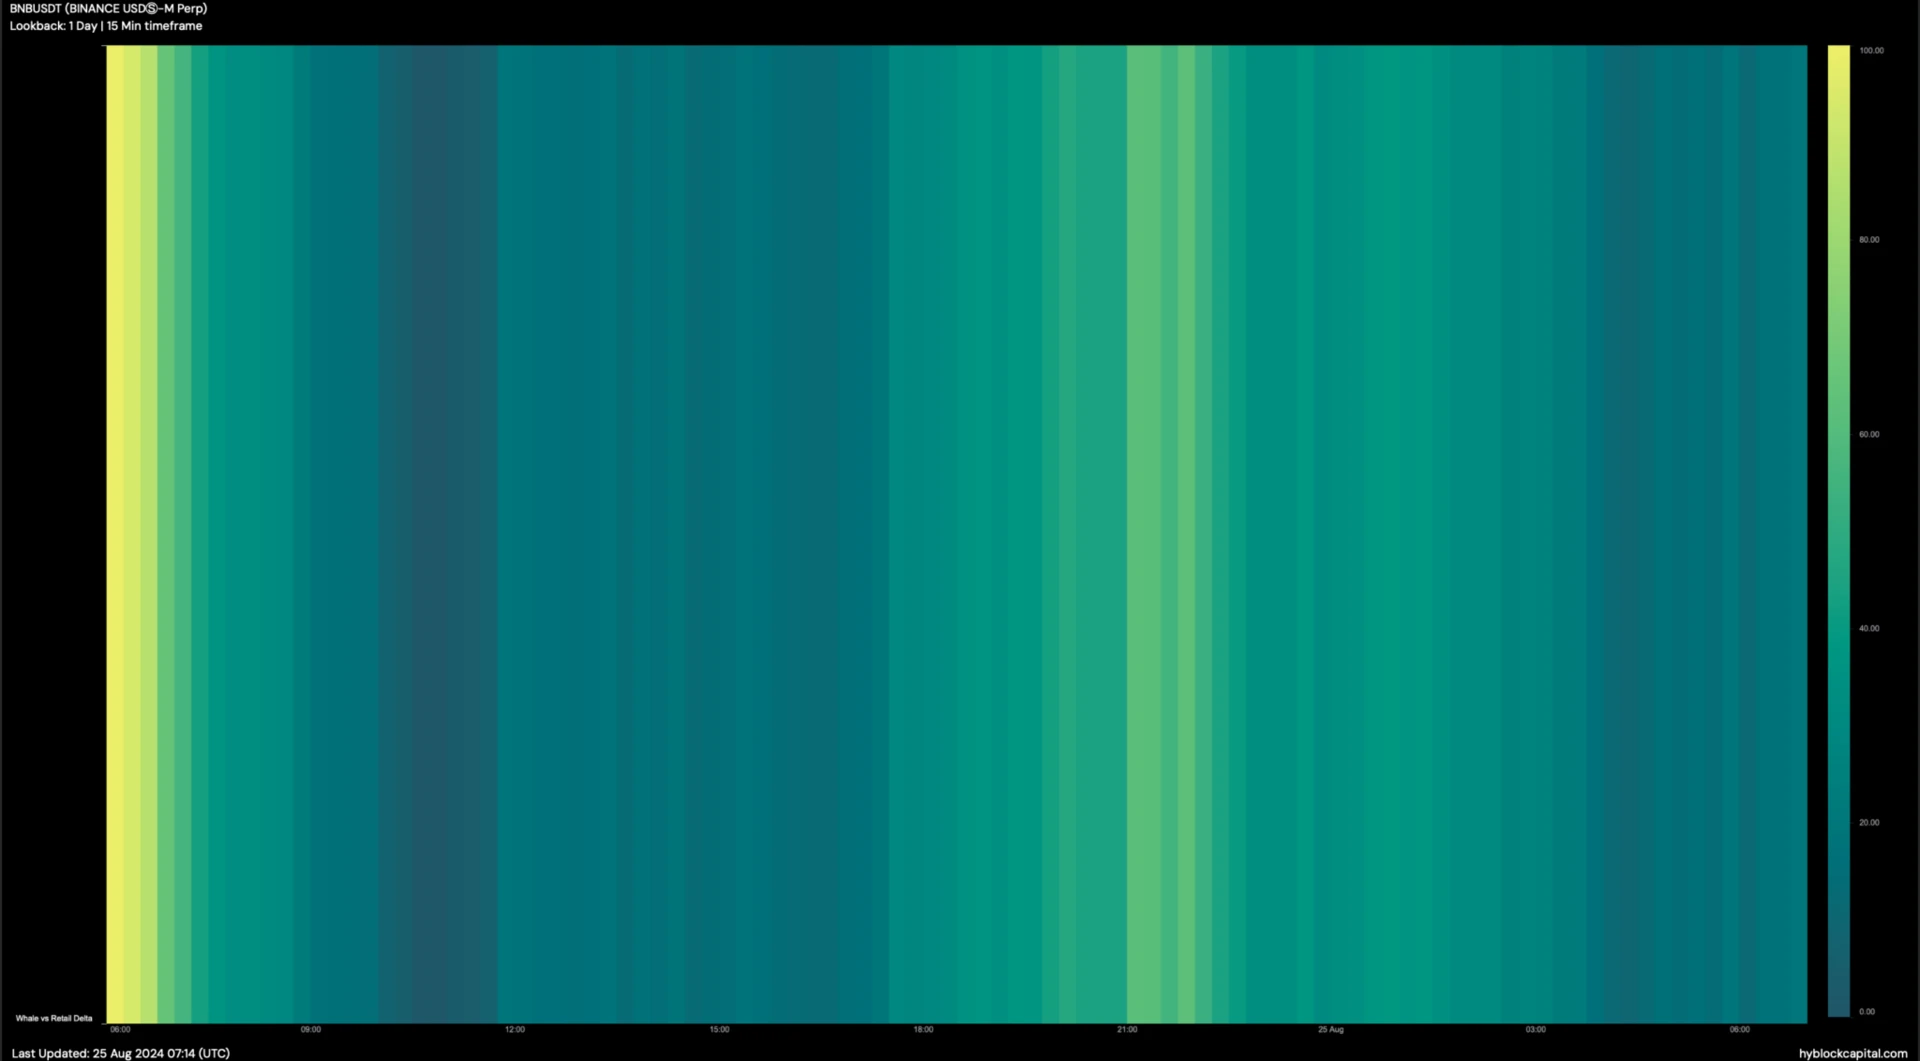
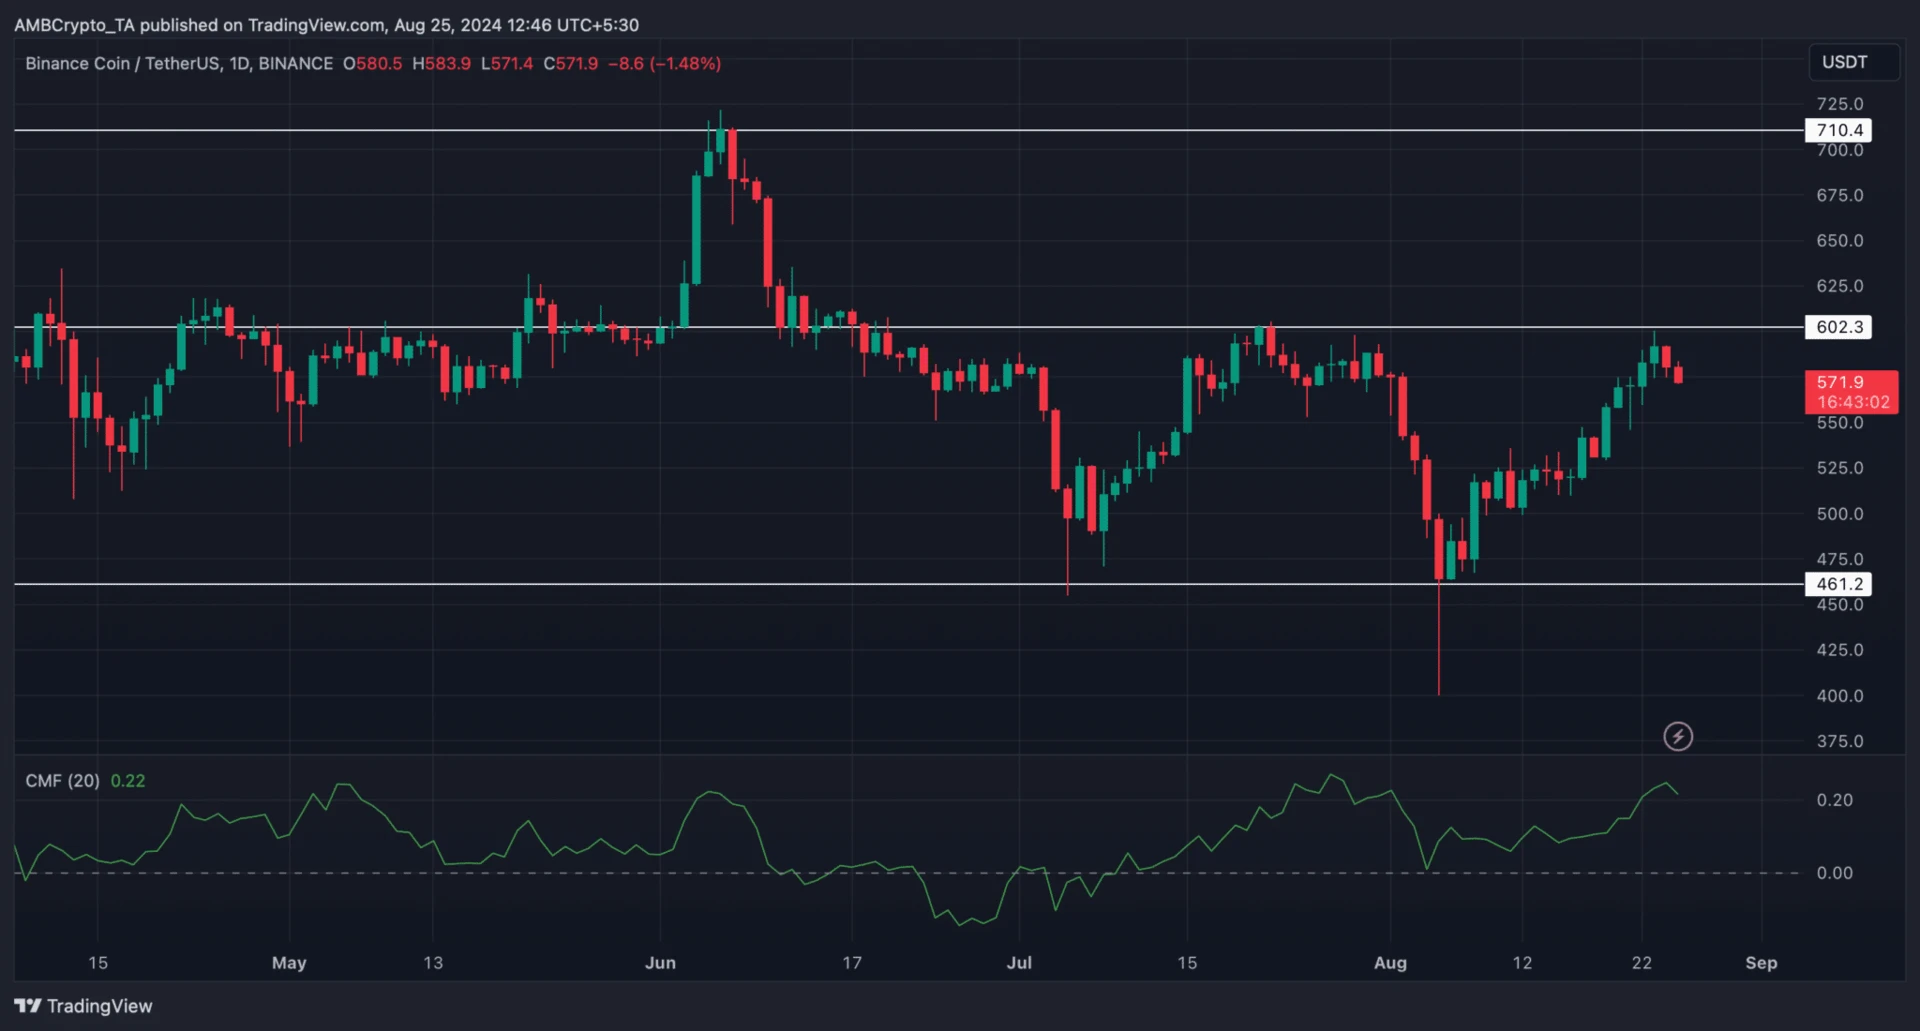
Chart Analysis Points to Potential Further Decline
A closer inspection of $BNB’s daily chart shows that the coin was recently rejected at its resistance level of $602.3. Additionally, the Chaikin Money Flow (CMF) indicator has registered a downturn, further hinting at a potential continued price decline in the coming days. Should this trend persist, it wouldn’t be surprising to see $BNB plummet to a target price of $461.