
Eyes are currently on $XRP, the sixth-largest cryptocurrency by market capitalization, as it awaits a major move - especially considering that the 50 Simple Moving Average (SMA) and the SMA 200 on $XRP's hourly chart have converged, setting the stage for a potential crossover. The big question remains whether this will result in a "golden cross" or a "death cross."
A golden cross occurs when a short-term moving average crosses above a long-term moving average, signaling a potential bullish trend. Conversely, a death cross happens when the short-term moving average crosses below the long-term moving average, indicating a potential bearish trend.
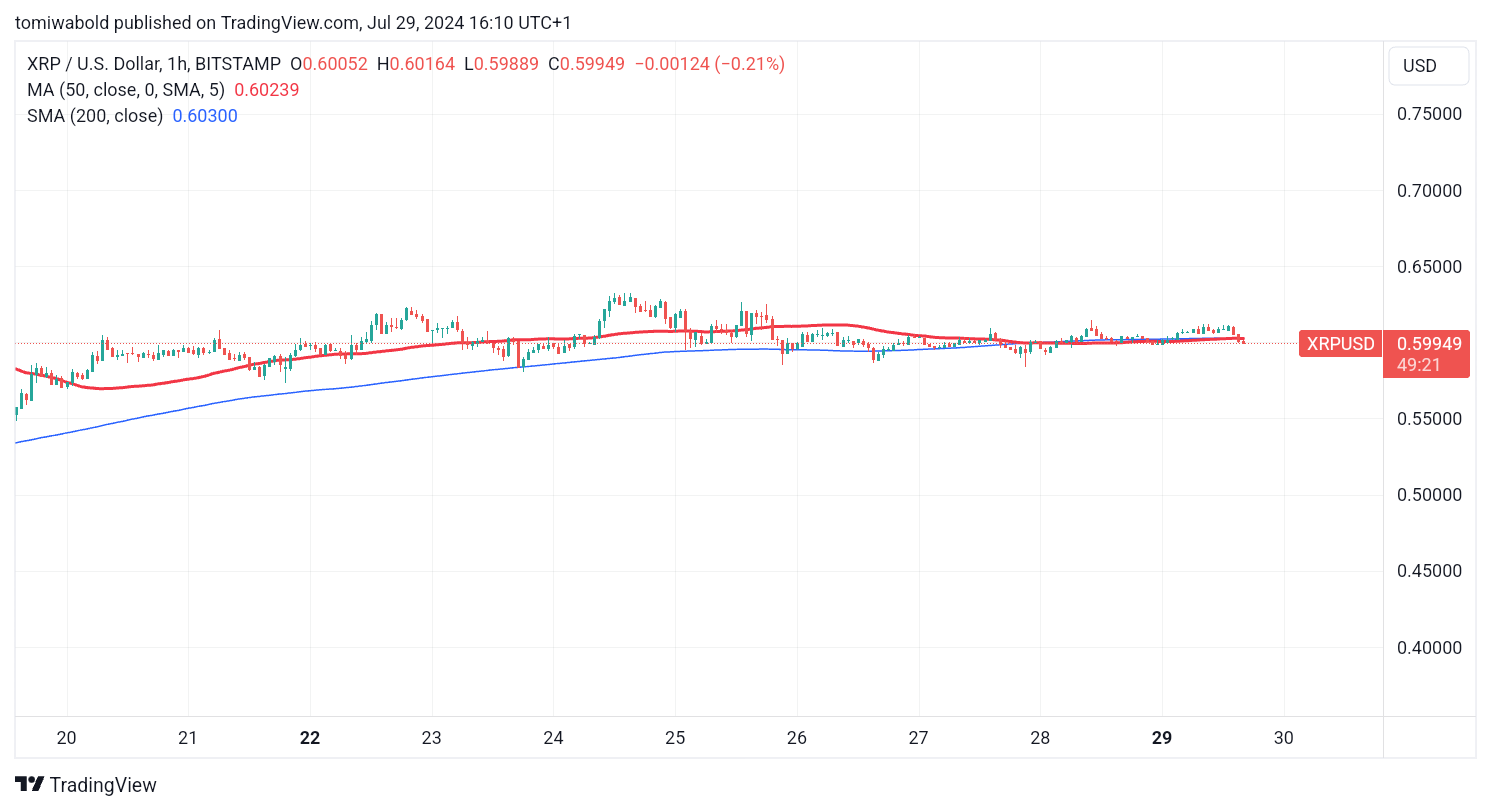
The convergence of the 50-hour and 200-hour SMAs suggests that a significant move might be imminent. As these key technical indicators draw closer together, market participants are closely watching for the direction of the crossover to gain insights into $XRP's next move.
The fact that $XRP recently posted a golden cross on its four-hour chart raises expectations of the nature of the crossover on the hourly charts.
What's next for $XRP's price?
$XRP has consolidated in a range since hitting highs of $0.6378 on July 17. The range currently has support at $0.542, which coincides with the daily SMA 200.
At the time of writing, $XRP was up 0.63% in the last 24 hours to $0.603. If the $XRP price returns above $0.61, the bulls might try to push it to $0.64. A move above $0.64 could kickstart a fresh bullish uptrend to $0.74. This level might prompt selling by the bears.
On the contrary, if the $XRP price falls below the daily moving averages, the bears might try to push $XRP to the support at $0.40. The next major move is expected to start on a break above $0.64 or below $0.54.
In the days ahead, the direction of the moving averages might be crucial to consider. Already the daily SMA 50 is tilting upwards on the daily chart, however, a potential crossover on the daily charts might come in the weeks or possibly months ahead.