
$XRP could finally be forming a pattern that will hint at the end of the prolonged downtrend we have been witnessing since March. However, it is only a sign of selling pressure winding down but not necessarily hinting at a prolonged reversal.
A possible cup bottom pattern, which is usually a bullish indication that an asset may be getting ready for a move higher is visible on the price chart of $XRP. The pattern's rounded bottom signifies that buyers are beginning to take the initiative, and selling pressure is beginning to lessen.
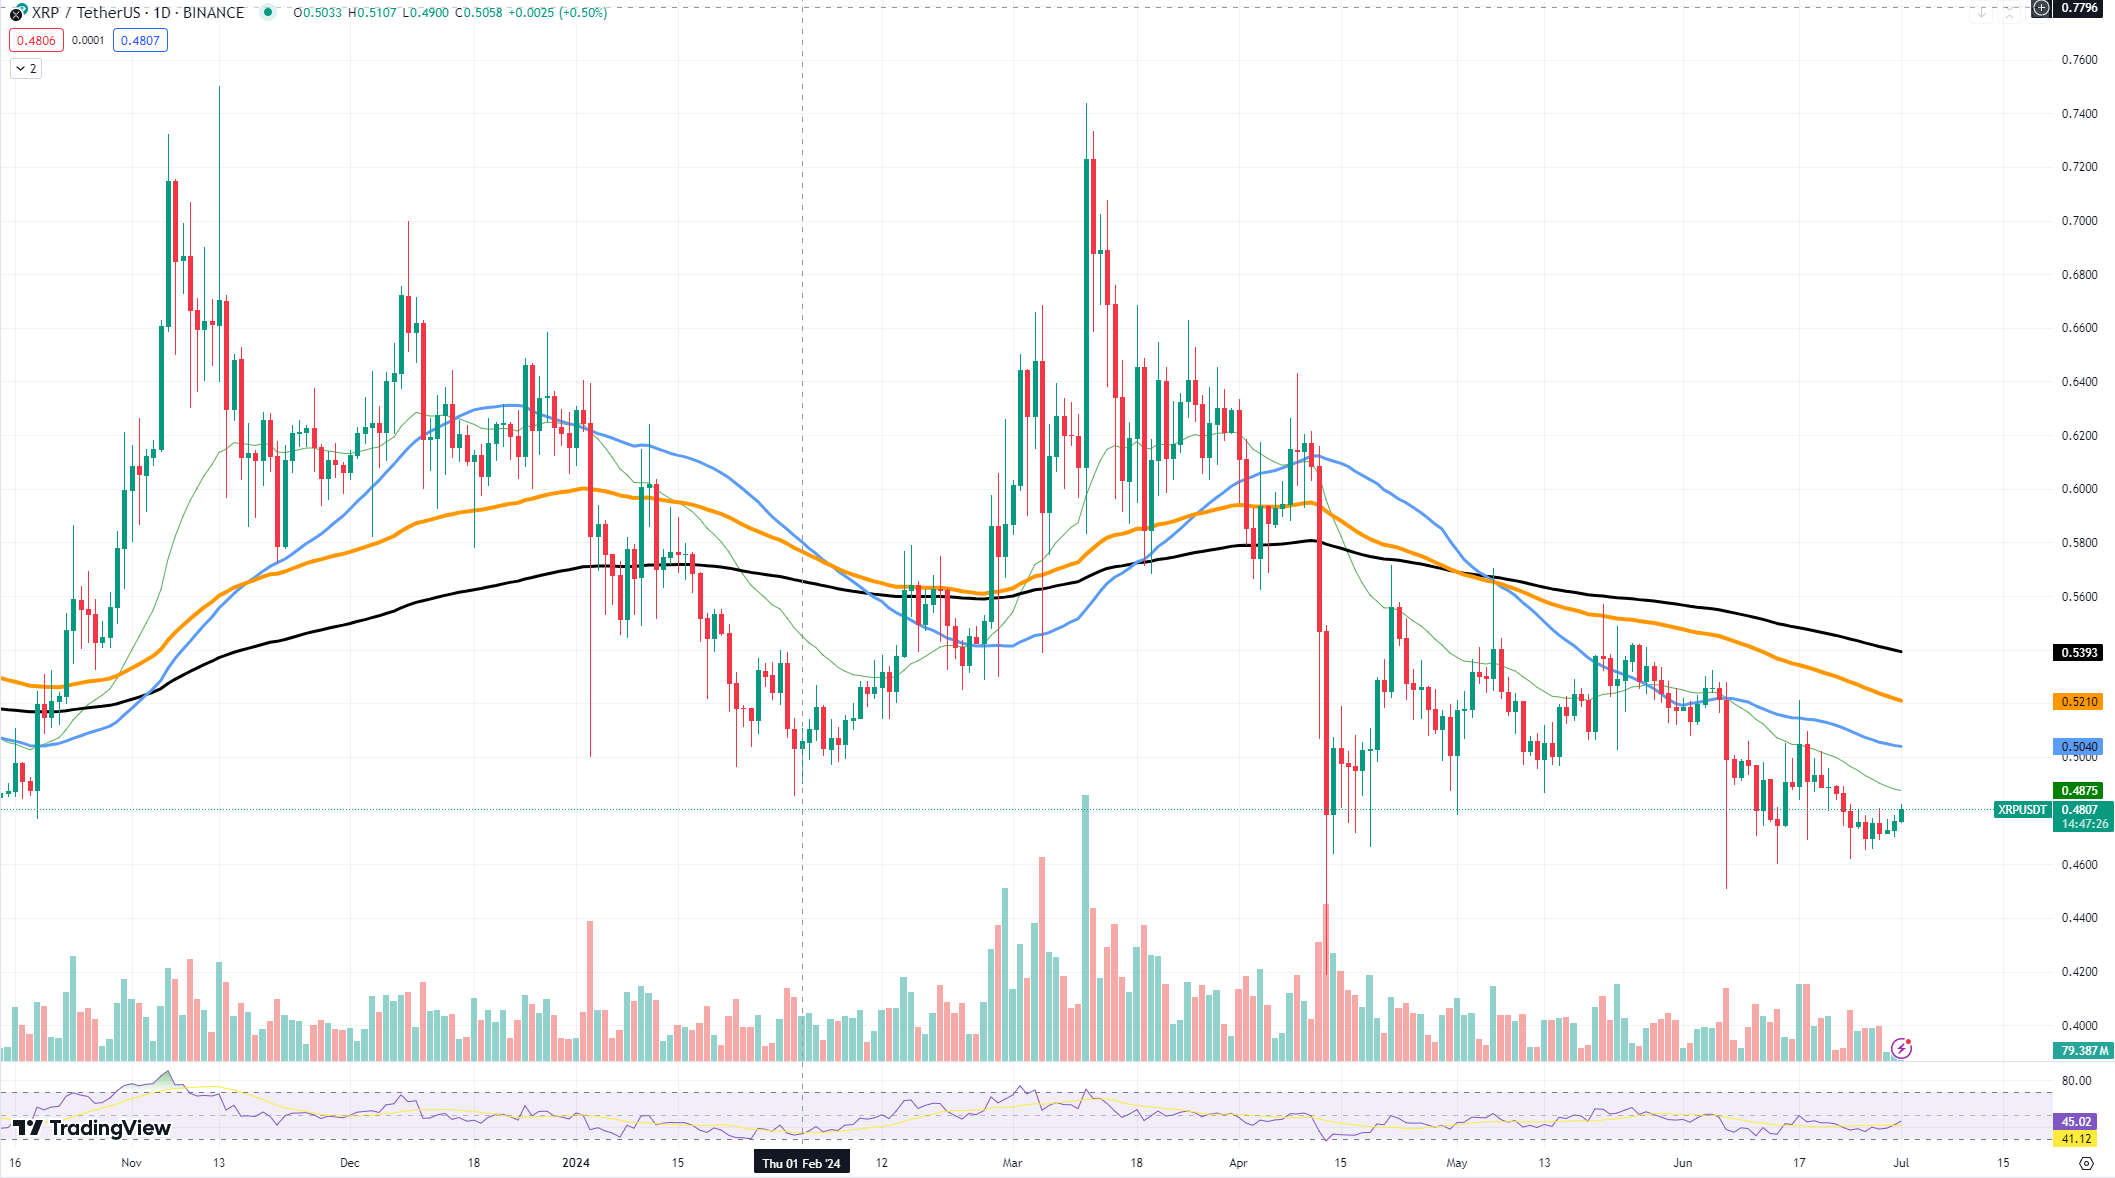
According to the way the price is moving right now, $XRP appears to be stabilizing at $0.47, which may provide support for future increases. Technical indicators lend credence to the possibility of a reversal. As $XRP tests its 50-day EMA at the moment, a successful break above it could open the door for a move toward the next resistance level, which is the 100-day EMA, located around $0.50.
If $XRP can maintain its upward momentum, the longer-term target is the 200-day EMA, which is currently at $0.53. $XRP is in the neutral zone and has room to rise before reaching overbought conditions, according to the RSI, which is 42. This shows that without a lot of selling pressure, buyers may still be able to drive the price higher.
Volume analysis indicates a decline in sales activity, which is good news for $XRP. On down days, the volume declines suggest that the bears are becoming weaker and that the bulls may be about to take control. $XRP must, however, see a rise in buying volume in order to confirm a breakout and establish a long-term uptrend.