As the price of Solana’s native SOL token keeps dropping from a 45-day low, a cryptocurrency analyst has recently predicted that despite a current bearish trend the smart contract platform’s native token will move to surpass the $1,000 mark in the future.
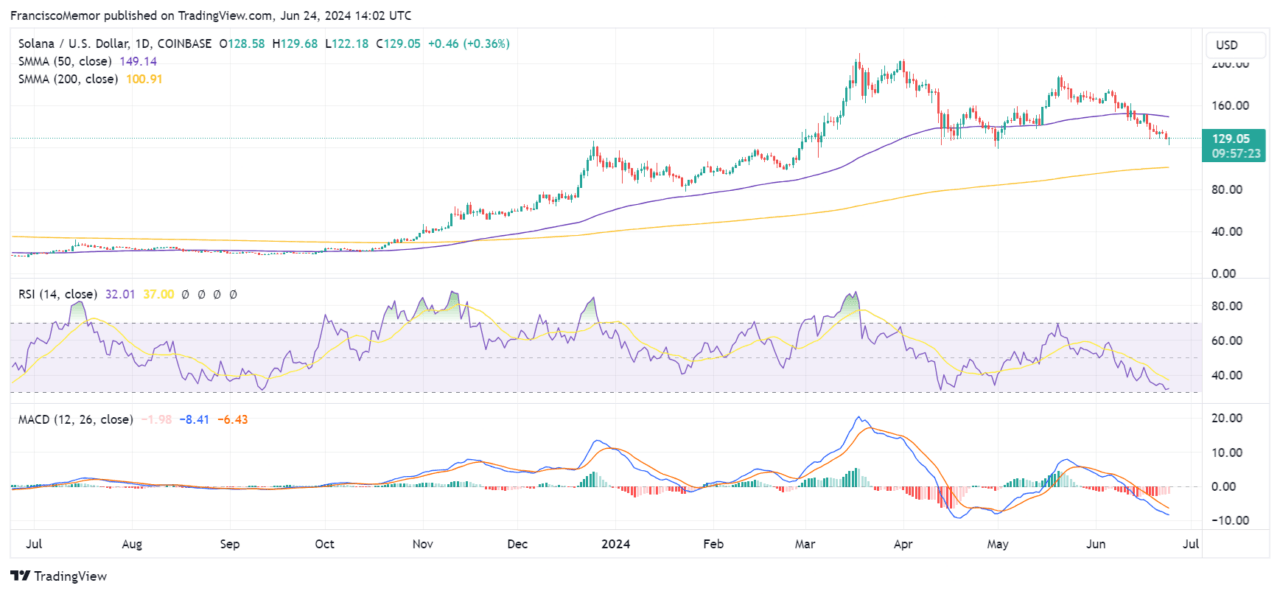
Solana is at the time of writing trading at $128 after losing around 15% of its value over the past week amid a wider cryptocurrency market downturn, with technical analysis of the cryptocurrency’s yearly price chart showing that its 50-simple moving average is currently at around $149, while the 200 SMA is at $100.9.
The cryptocurrency’s price is below its 50 SMA but above the 200 SMA which shows a short-term bearish sentiment within a long-term bullish trend if the price remains above the 200 SMA.
SOL’s Relative Strength Index (RSI) meanwhile sits at 32, considered to be oversold territory, and has been trending downward as bearish momentum grows. Meanwhile the Moving Average Convergence Divergence (MACD) indicator’s line crossed below its signal line, another bearish signal.

The MACD’s histogram suggests there’s ongoing bearish momentum for Solana as it moves to test its support level near the 200 SMA. Another support level is at around $122, its recent low from which the price bounced back from.
Solana’s price faces resistance at around the 50 SMA, or $149, and a break above this level could see Solana resume its bullish trend.
Solana’s ‘$1,000 Roadmap’
On social media a pseudonymous cryptocurrency analyst, Crypto Patel, showed a long-germ SOL price chart suggesting it could move to the $1,000 mark. The chart shows the formation of a giant cup and handle pattern.
#SOLANA $1000 Roadmap 🚀$SOL pic.twitter.com/s7KipEbDTd
— Crypto Patel (@CryptoPatel) June 22, 2024
A cup and handle pattern occurs when the price of a security trends downward and recovers to form a “u” shape, before seeing another slight downward drift that forms the handle. It’s widely considered a bullish signal.
Also read: AI Prediction: Ethereum (ETH) vs Solana (SOL) – Which Is Likely the Better Buy for the Rest of 2024
Featured image via Unsplash.
 cryptoglobe.com