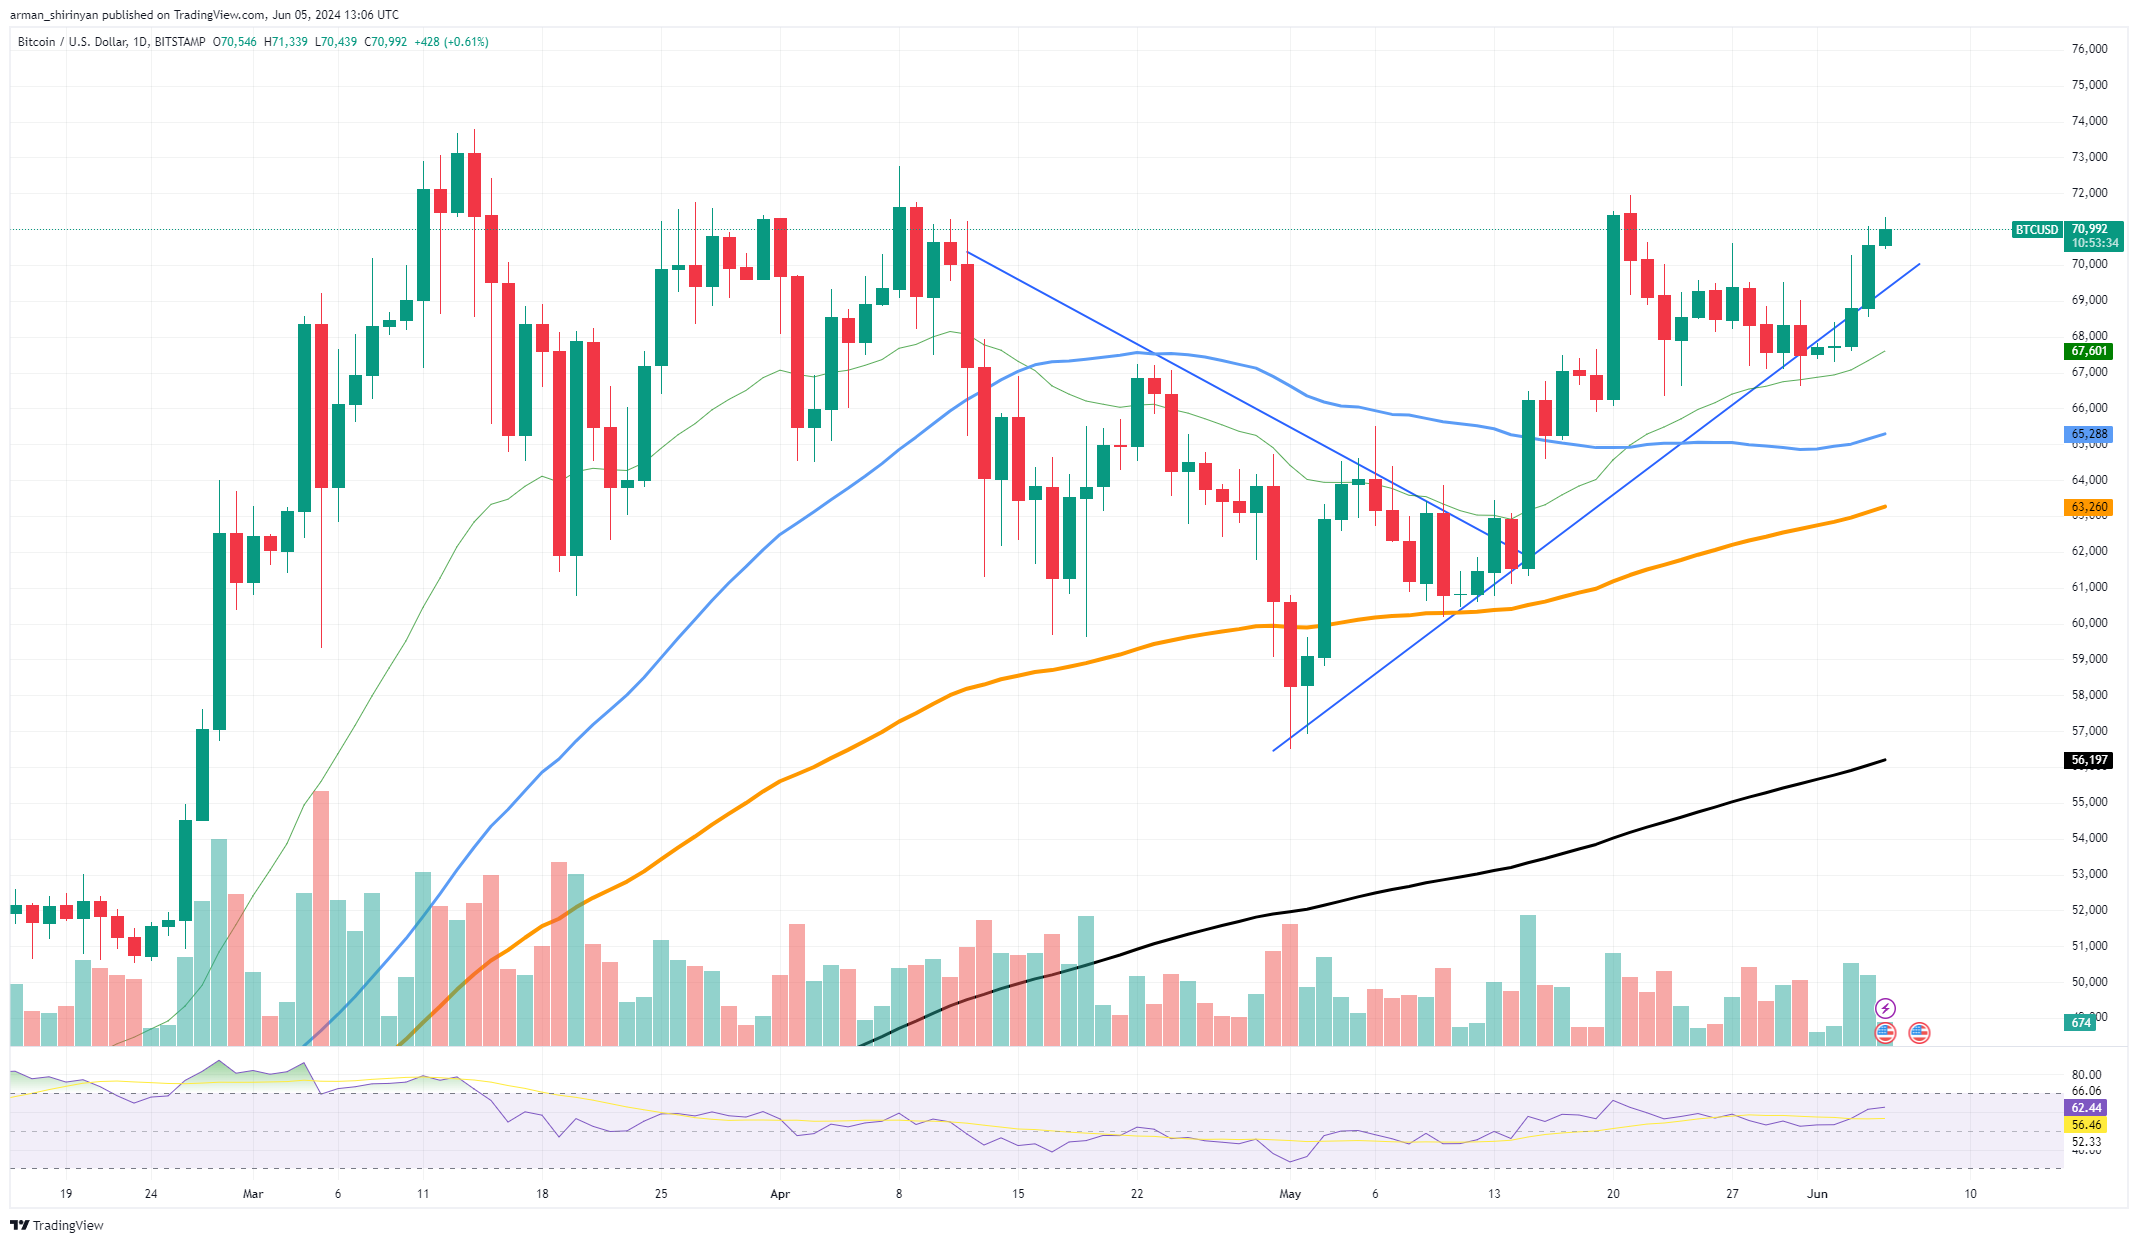
Bitcoin has finally broken through $70,000, setting itself up for further growth. As we can see, there is a good chance it will succeed at it, as the price is moving closer to $71,000 and trading volumes remain elevated.
This bullish momentum is easily visible on the daily chart of Bitcoin versus the U.S. dollar (BTC/USD). Bitcoin is currently trading around $70,977 with the price action showing a steady climb. A major turning point was reached recently when the market broke above $70,000, indicating fresh interest and optimism. This optimistic view is supported by several important technical indicators.

The 50-day and 200-day moving averages in particular are positioned in a way that indicates sustained upward momentum. A traditional bullish signal known as a golden cross formed when the 50-day moving average crossed above the 200-day moving average.
Volume analysis supports this optimistic scenario even more. The recent price surge is accompanied by elevated trading volumes, indicating strong market participation and interest at these price points. Maintaining the present upward trend and possibly pushing Bitcoin above $71,000 require this volume support.
Furthermore Bitcoin remains a favorable investment option given the current macroeconomic climate. Bitcoin's allure as a store of value and safeguard against the devaluation of fiat currencies is still great in light of persistent worries about economic stability.
Ethereum's weird position
The surge toward $3,800 was not expected by the market, yet we are here. However, Ethereum's activity raises a lot of questions as the asset's price is going through an extremely prolonged consolidation phase, and it is unclear whether or not it will come out as a winner from it.
After the steep increase to $3,800, the price of Ethereum has been trapped in a narrow range, as can be seen by looking at the daily chart of ETH against the USD. When buyers and sellers are evenly matched, the market is usually in a state of indecision, as indicated by this sideways movement.
Ethereum has tested $3,750 several times without breaking below what appears to be the key support level. A number of technical indicators shed light on Ethereum's present situation. A golden cross, or the potential continuation of a bullish trend, could be indicated if the 50-day moving average, which is approaching the 200-day moving average, crosses above it. However, the market continues to be cautious until such a crossover occurs.
Further more, the fact that trading volumes have been comparatively low during this phase of consolidation suggests that a sizable portion of market participants are holding off until a more distinct trend becomes apparent.
Solana's market position
Solana's path on the market was tough in the last few weeks, but things are changing rapidly, with Bitcoin bouncing toward $70,000 and investors gaining some of that positive sentiment back. However, fundamentally, Solana might not be doing as well as it used to.
Solana shows a gradual but consistent recovery. The 50-day and 200-day moving averages are supporting the modest uptrend that Solana is currently showing at about $172. 92.
Though technical indicators point to a bright future, the larger ecosystem surrounding Solana paints a different picture. The Solana meme coin scene used to be a hive of activity and creativity, but it is not as active as recently.
There has not been much buying interest in Solana, as seen by the low trading volume. This is concerning because price movements need to be supported and maintained by sustained volume, which is probably the biggest issue for it right now.
 u.today