Like previous times, meme coins were stars of the show after the market recovered between May 3 and 4. As usual, dogwifhat [WIF] led the cohort with a 24-hour 20.58% increase. Dogecoin (DOGE) also climbed by 13.80% while Pepe (PEPE) increased by 12.93%.
The likes of Floki (FLOKI), Bonk (BONK), and Shiba Inu (SHIB) also joined the rally as their prices outperformed most of the other assets in the market.
WIF vs. DOGE
WIF’s price at press time was $3.32 with the 4-hour chart showing no resistance in sight. If this continues to be the case, bears might be unable to stop WIF’s bullish momentum.
The 1.618 golden ratio indicated that the meme coin could target $4.36 as its next support level. Meanwhile, DOGE also correlates with WIF. Should this correlation remain the same, a 19.17% increase awaits DOGE. From its press time price, DOGE might climb toward $0.18 within a short period.
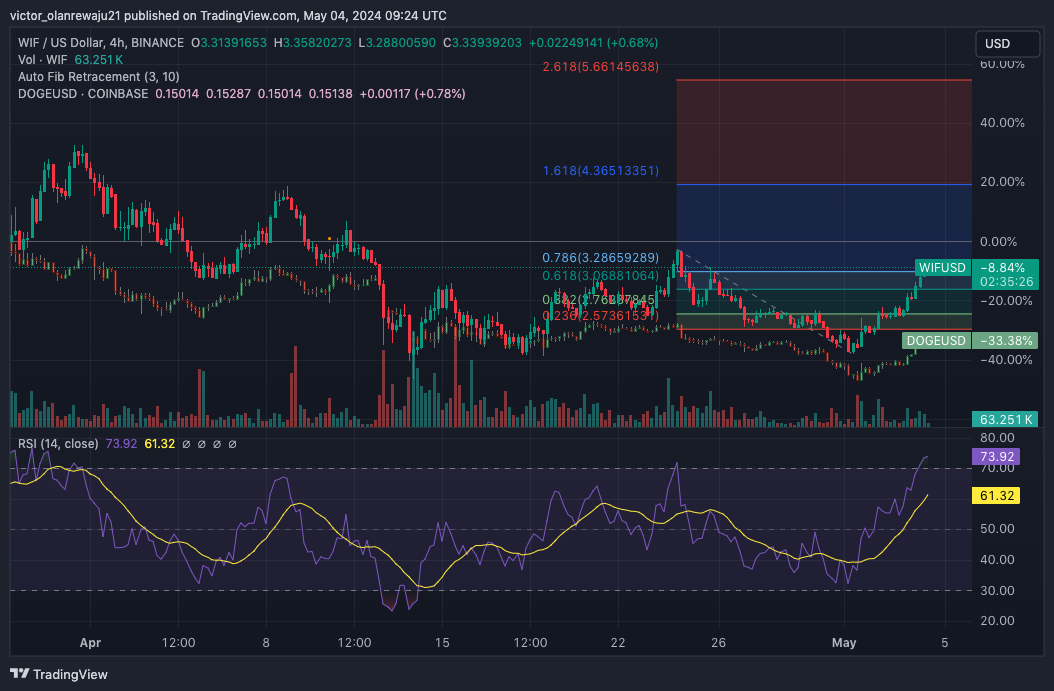
WIF 4-Hour Analysis Against DOGE (Source: TradingView)
However, traders might need to watch out as the RSI showed that WIF was overbought and DOGE was close to a similar spot. If profit-taking begins, the prices of the cryptocurrencies might retrace. On the other hand, a bullish scenario could hand them a higher value.
PEPE vs. FLOKI
PEPE’s market structure was similar to WIF, and FLOKI too was not left out. According to the 4-hour chart, the breakout PEPE and FLOKI experienced was due to the bullish flag formation.
This happened as a result of sellers’ exhaustion. As such, if PEPE’s price rises, there is a high chance the FLOKI will do the same. Also, if the price of PEPE falls, FLOKI might dump. Furthermore, the Awesome Oscillator (AO) was positive, indicating an increasing upward momentum.
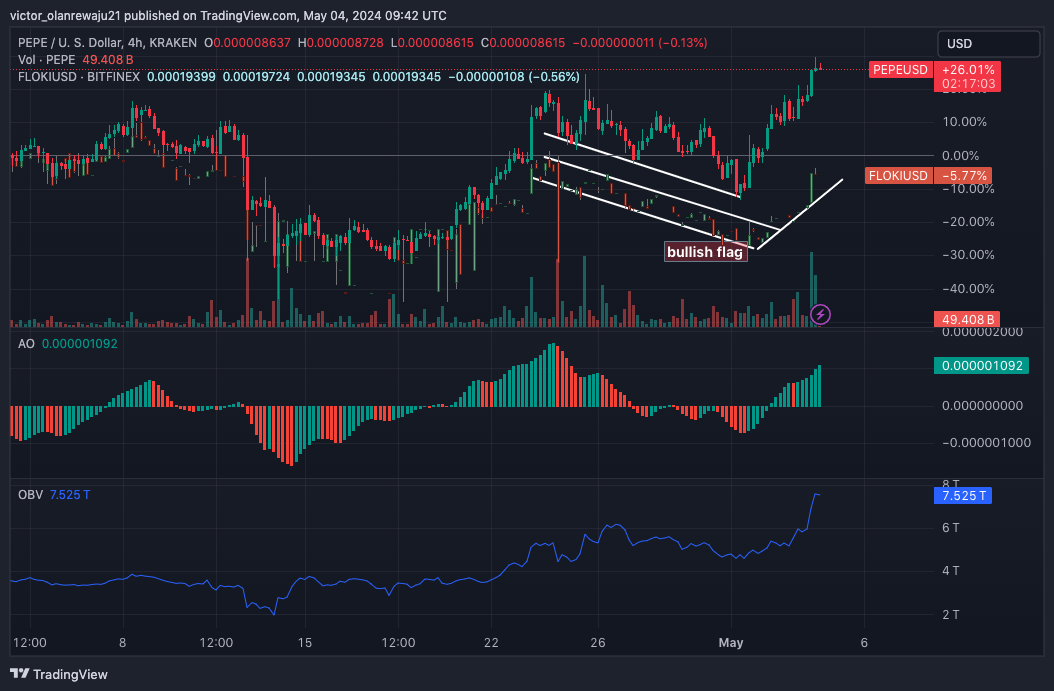
PEPE 4-Hour Analysis Against FLOKI (Source: TradingView)
Therefore, the price of the PEPE might continue to rise as well as that of FLOKI. In addition, the On Balance Volume (OBV) increased suggesting that buying pressure was intense to keep the price up.
BONK vs. SHIB
Comparing the BONK and SHIB charts showed that there was a difference in the trend. While prices moved together at some point, they decoupled on other occasions. However, the Money Flow Index (MFI) on the BONK/USD 4-hour chart showed that the token was overbought.

BONK 4-Hour Analysis Against SHIB (Source: TradingView)
This was because the MFI reading was 89.99. Reading over 80.00 indicates that an asset is overbought. Although the reading also signaled that capital flow was high, traders might soon begin to take their money out, leaving SHIB and BONK prices to fall.
Disclaimer: The information presented in this article is for informational and educational purposes only. The article does not constitute financial advice or advice of any kind. Coin Edition is not responsible for any losses incurred as a result of the utilization of content, products, or services mentioned. Readers are advised to exercise caution before taking any action related to the company.