- Dogecoin price declined 4 percent on the day, receding as low as $0.1931
- Price stuck in downtrend since a month as buyers struggle to consolidate any form of momentum
- Trading volume rose around 2 percent to compound problems for the meme token
Dogecoin price analysis shows a continuation of downtrend that has been set since November 15. Price declined 4 percent during the day’s trade to go as low as $0.1931, the lowest over the last 3 months. DOGE seems to be stuck in a downtrend that set after a high of $0.3887 on October 28, as buyers seem to be failing to consolidate momentum. Currently, price is in a state of free fall, which could also spell an opportunity for buyers to come into the market.
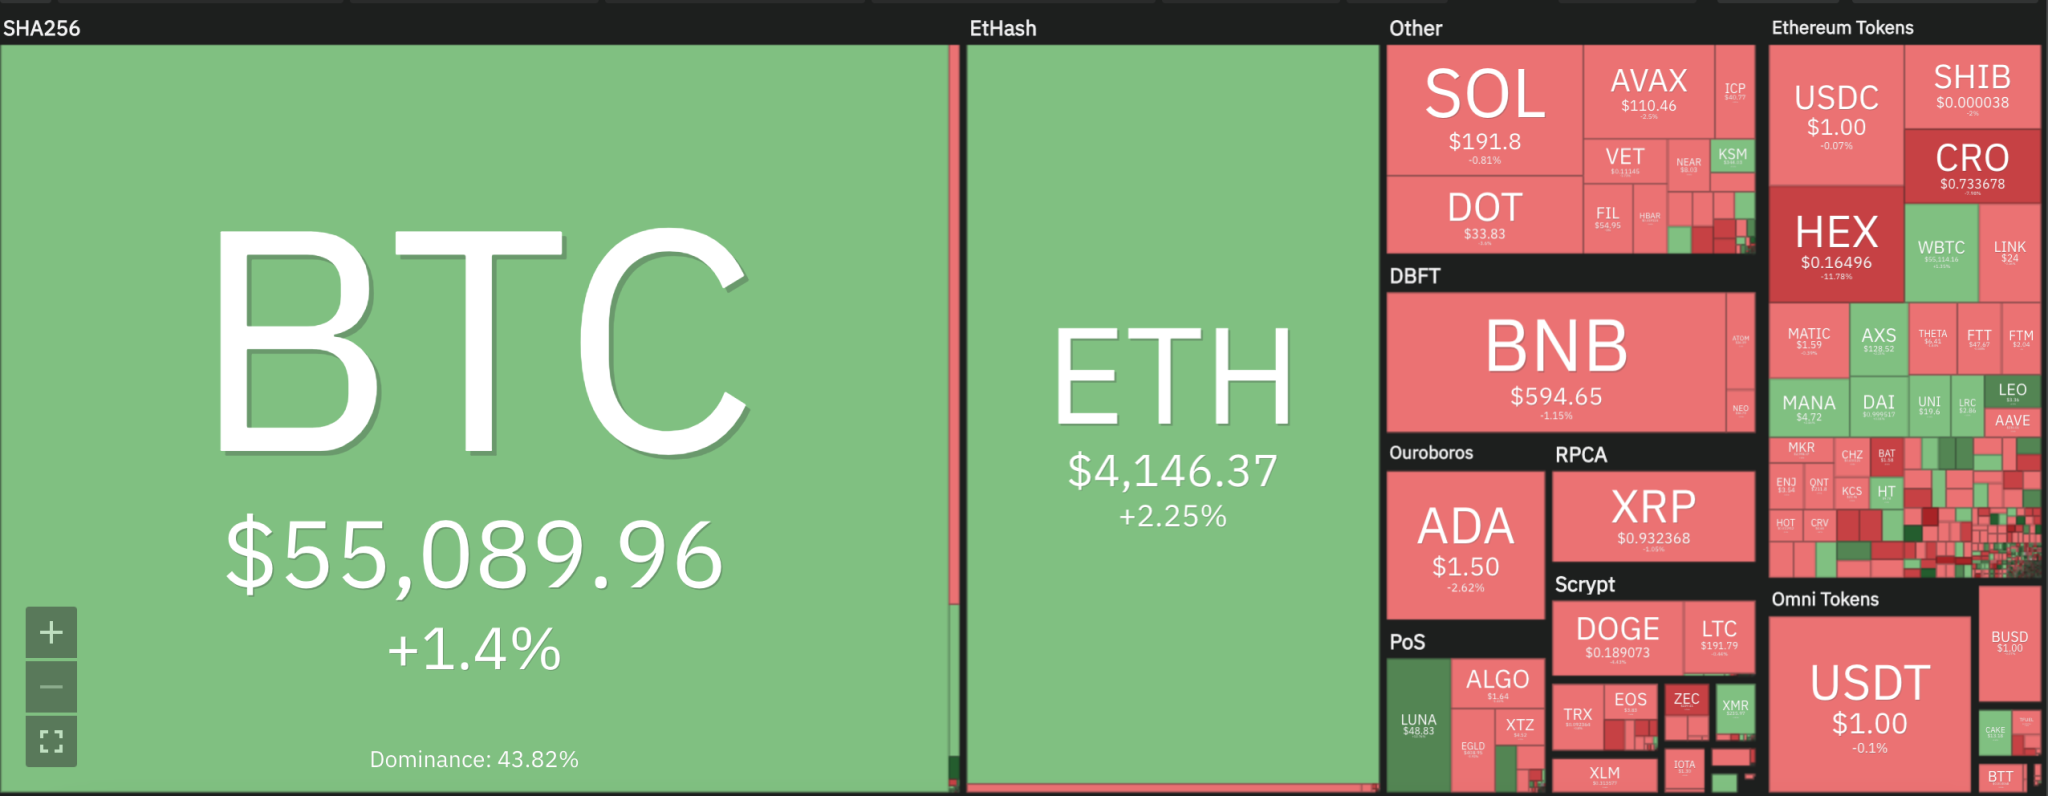
Dogecoin’s struggles can also be reflected within the larger cryptocurrency market, where Altcoins can be seen in the reds. Ripple and Cardano decreased 2 percent each to sit at $0.93 and $1.50, respectively. Litecoin also dropped 2 percent down to $191.66, whereas Polkadot suffered a 6 percent decline. Comparatively, Bitcoin and Ethereum showed some momentum, upping 2 percent each to move above $55,000 and $4,000, respectively.
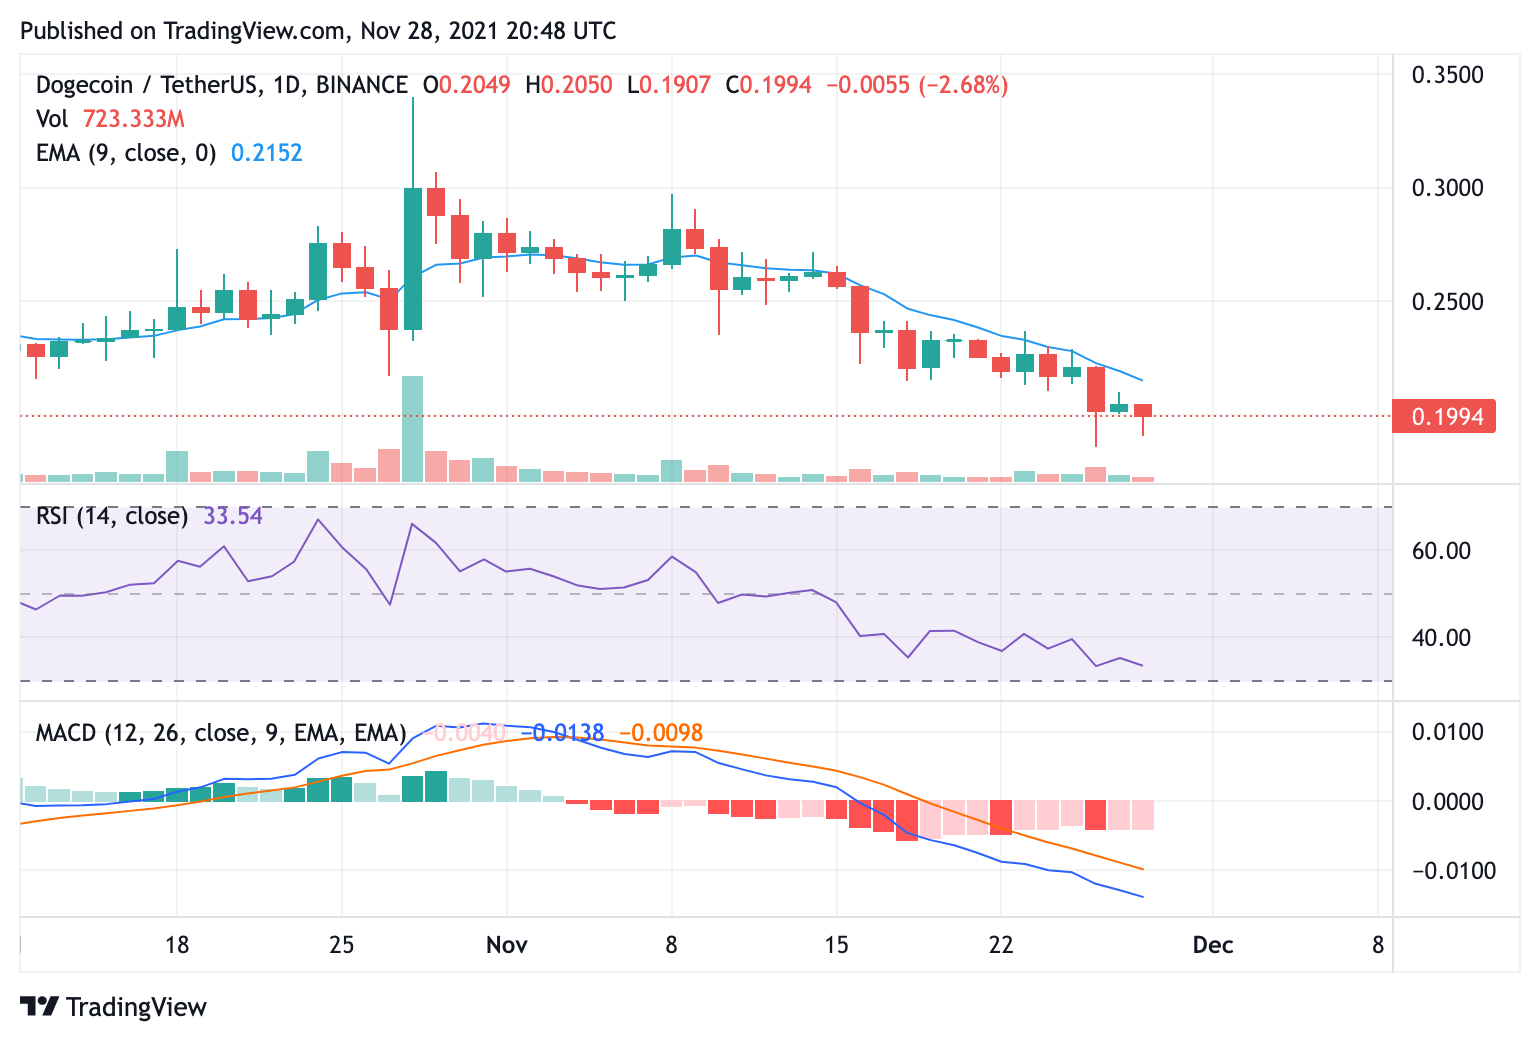
DOGE/USD 24-hour chart: Low RSI shows depth of downtrend
On the 24-hour chart for Dogecoin price analysis, the Relative Strength Index (RSI) value of 33.46 shows the intensity of price confinement the token is facing currently. Price has been oscillating between a low range of $0.186 and $0.208, unable to match the crucial Exponential Moving Average at $0.2147. The Moving Average Convergence Divergence (MACD) curve also represents the extent of bearish downtrend the meme cryptocurrency finds itself in. The curve sits well distant from its neutral zone, below the 0.00 mark.
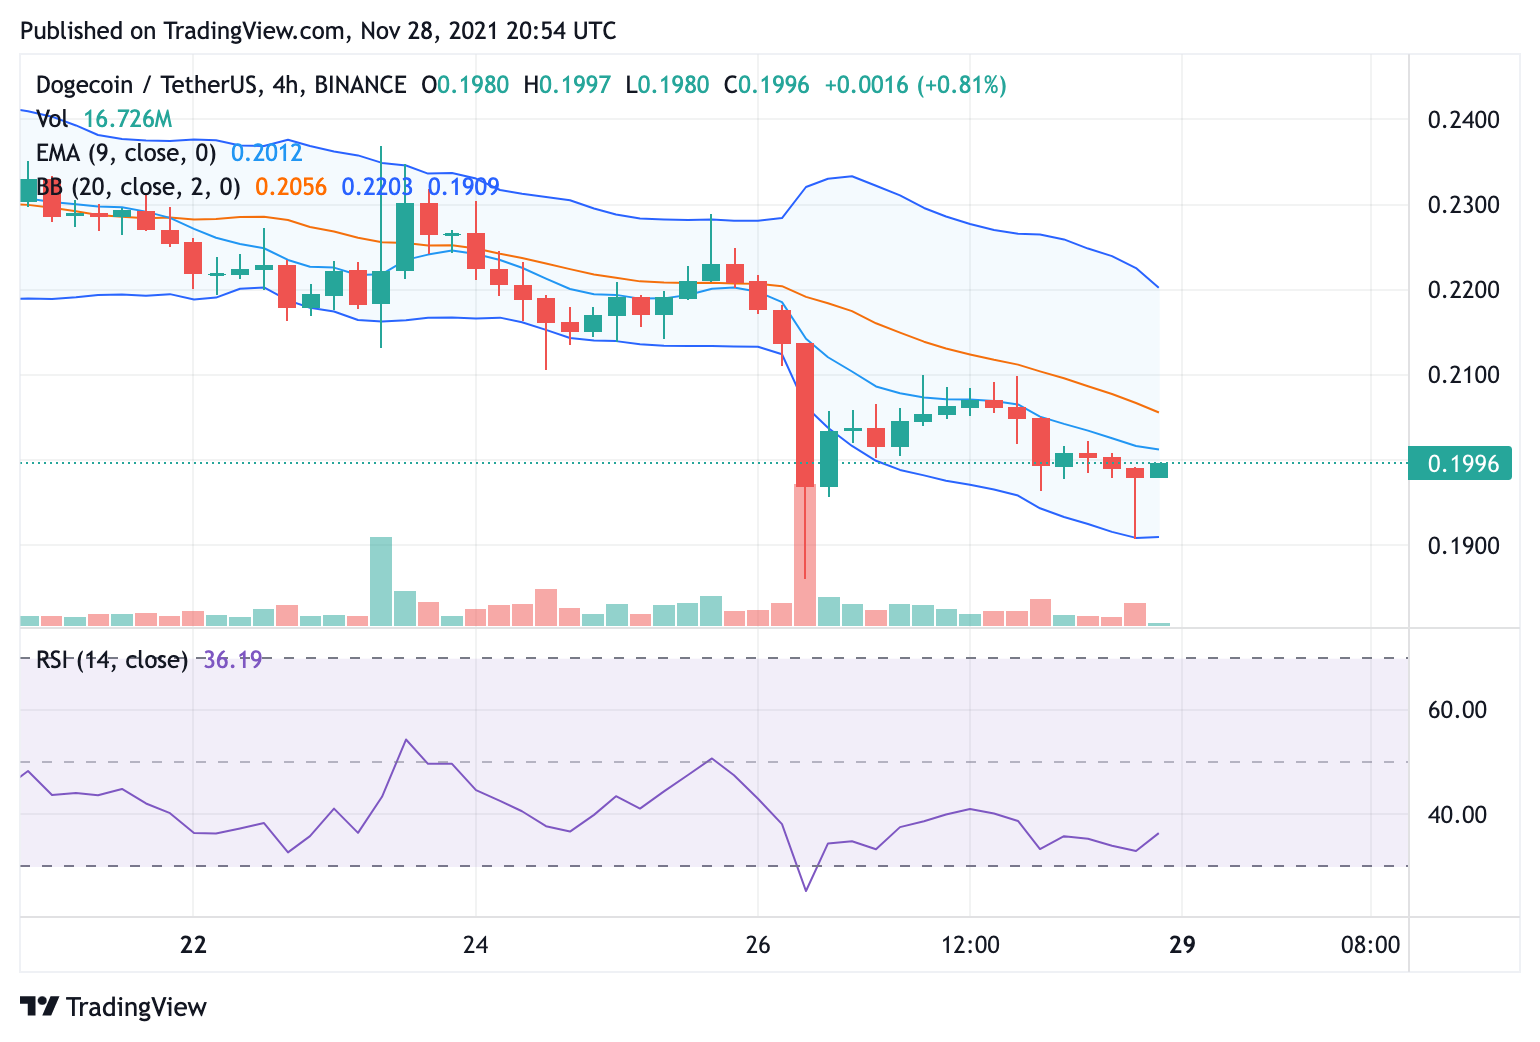
DOGE/USD 4-hour chart: Buyers coming late into the market to avoid hitting support
The 4-hour chart also shows Dogecoin’s struggles in terms of consolidating some form of momentum, with the RSI value sitting at a lowly 35.60. However, over the last few trading sessions, buyers seem to be coming into the market to rescue price from hitting the support floor at $0.1869. This can be taken as a sign of opportunity for a reversal, as also seen with the likes of Bitcoin and Ethereum. Price currently sits between the bottom two curves of the Bollinger Bands, indicating that price is moving towards the upper bands.
Dogecoin price analysis: Conclusion
Technical indicators signify Dogecoin’s downtrend that has been in place for more than a month, but it can also be taken as an opportunity for buyers to come into the market and form a reversal. The RSI values show distinct undervaluation, adding to the increasing trading volume that shows majority selling action. Price movement below the support floor at $0.186 could see DOGE fall further out of favour, having already faced stiff competition from Shiba Inu as a meme cryptocurrency.