- Price has heightened up to an all-time high level.
- Avalanche price analysis shows an uptrend.
- Support is present at $76.3.
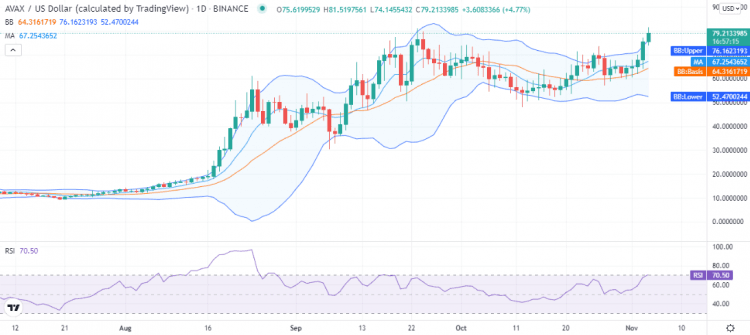
The Avalanche price analysis shows the coin is at an all-time high of $79 as the bullish progression still continues. Yesterday the AVAX/USD price capped at $75.5, just a dollar below the previous all-time high of $76.5, but today bulls took the price further high to a new record high level, and we hope that the bulls will maintain the upside today, marking a record high. The price was seen going as high as $81.2 at one point but reverted back and is still present above $79.
AVAX/USD 1-day price chart: Bulls on a march to score a record high
The 1-day price chart for Avalanche price analysis shows that bulls are continuing their endeavor to take the bar higher as they already are present above $79, 79.2 to be exact, the value at which the crypto pair is trading at the time of writing. Today is the fifth consecutive day of the nonstop bullish momentum, and the coin has gained significant value during this time, coming from $62 to the current price level.
Overall, AVAX has gained a value of 11.33 percent over the last 24 hours and a value of 28.11 percent over the course of the last seven days. The trading volume also went up by 92 percent during this time, improving the market cap by 9.91 percent for the 13th ranked cryptocurrency Avalanche.

The volatility for the coin is also increasing as the Bollinger bands show expansion with its upper limit at $76 and the lower limit at $52, making an average at $64. The upper limit of the volatility indicator represents support for the AVAX/USD pair. The moving average is also trading at $67.
The relative strength index (RSI) is on the borderline of the overbought zone as it is trading at index 70, almost leaving the neutral zone.
Avalanche price analysis: Recent developments and further technical indications
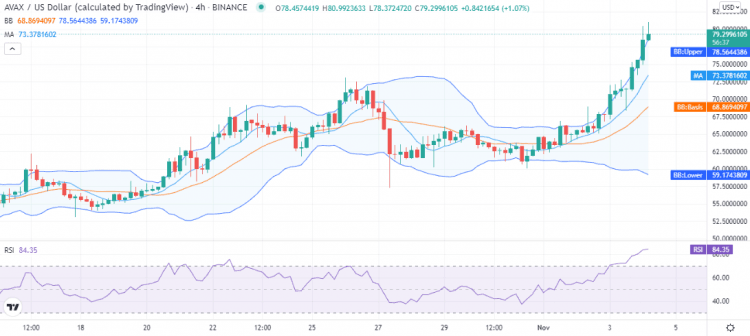
The 4-hour Avalanche price analysis shows that the coin has been on an upwards trend for more than 28 hours with no traces of bearish hindrance. This considerably is a long time, and an hourly correction may start at any time. As the traders might want to book profits or fear of a short-term pullback may trigger a correction, as the RSI is also predicting.

The RSI on the 4-hour chart though in the overbought region but has flattened out, indicating tiredness of bulls after a high and continuous rally. The RSI may take a turn back in the coming hours, calling a sell-off. The volatility is quite high on the 4-hour chart as well, with the upper Bollinger band indicating support for AVAX at $78.5.
Avalanche price analysis conclusion
The Avalanche price analysis shows the price is at an all-time high level of $79.2 after swinging as high as $81.2. But the RSI indicates a slow down in bullish progress, and a short-term pullback is also possible if selling pressure kicks in. Traders can expect a new record high today if the bullish momentum continues and the price gets capped above $76.5.
Disclaimer. The information provided is not trading advice. Cryptopolitan.com holds no liability for any investments made based on the information provided on this page. We strongly recommend independent research and/or consultation with a qualified professional before making any investment decisions.
 cryptopolitan.com