
$BNB price (Binance coin) is down over 25% and trading below $250 against the US Dollar. The price could drop further toward the $200 support.
- Binance coin price is moving lower below the $250 support against the US Dollar.
- The price is now trading below $250 and the 100-day simple moving average.
- There is a key bearish trend line forming with resistance near $280 on the daily chart of the $BNB/USD pair (data source from Binance).
- The pair could accelerate further lower if it breaks the $220 support zone.
$BNB Price Continues To Bleed
In the past few days, $BNB price saw a major decline from well above $280 against the US Dollar. The recent SEC lawsuit against Binance is not helping $BNB. It is also putting bearish pressure on Bitcoin and Ethereum.
The last major high was formed near $352 before the price declined heavily. There was a clear move below the $280 and $250 levels. The decline was such that the price tested the key $220 support zone. $BNB price is now trading below $250 and the 100-day simple moving average.
A low is formed near $221.2 and the price is now consolidating losses. On the upside, $BNB is facing resistance near the $240 level. The first major resistance is near $250. It is close to the 23.6% Fib retracement level of the downward move from the $352 swing high to the $221 low.
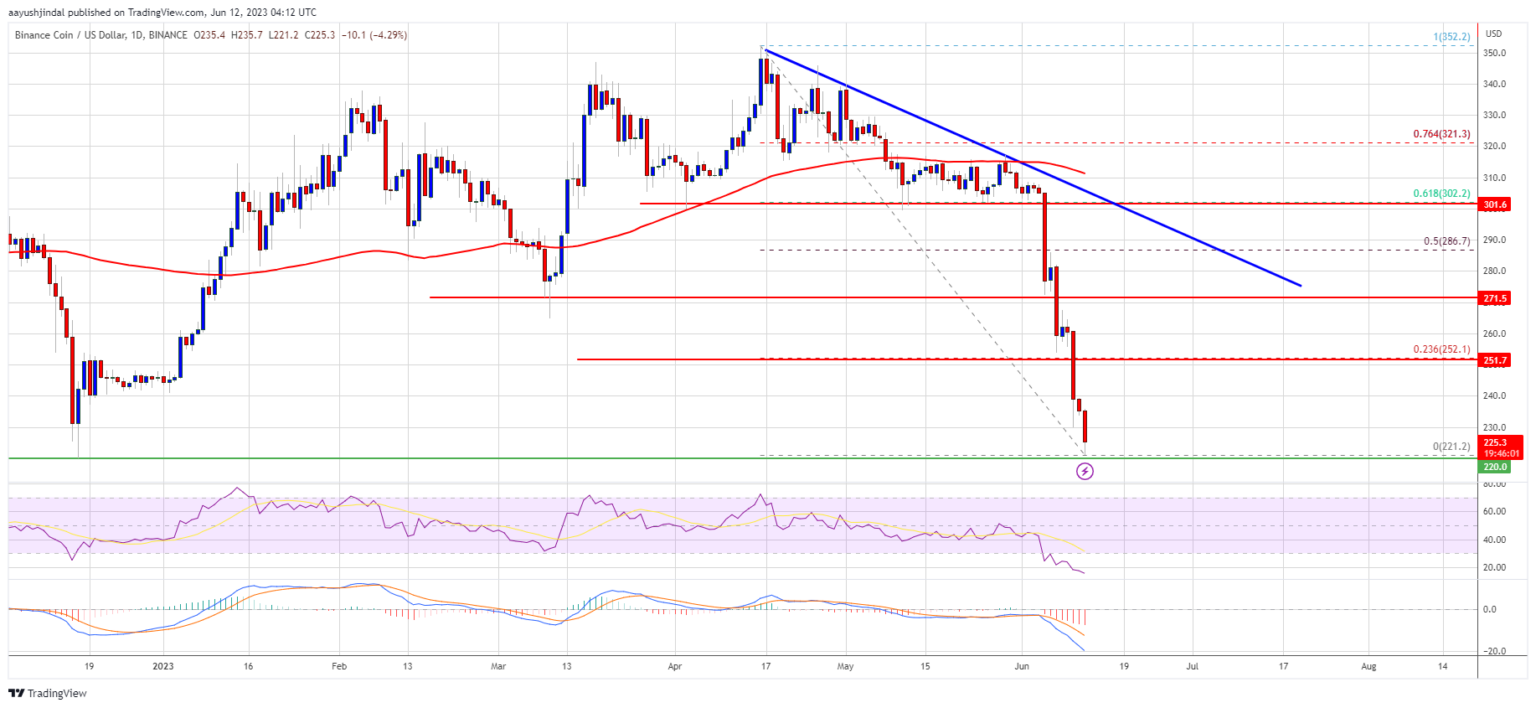
Source: BNBUSD on TradingView.com
The next major resistance is near $270. The main resistance is now near $280 or the trend line or the 50% Fib retracement level of the downward move from the $352 swing high to the $221 low. A clear move above the $280 resistance might start a steady increase. The next major resistance is near the $300 level, above which the price might rise toward the $325 resistance.
More Losses?
If $BNB fails to clear the $250 resistance, it could continue to move down. Initial support on the downside is near the $220 level.
The next major support is near the $200 level. If there is a downside break below the $200 support, there could be an extended decline toward the $180 support. Any more losses could send the price toward the $164 support.
Technical Indicators
Daily MACD – The MACD for $BNB/USD is gaining pace in the bearish zone.
Daily RSI (Relative Strength Index) – The RSI for $BNB/USD is currently below the 50 level.
Major Support Levels – $220, $200, and $180.
Major Resistance Levels – $240, $250, and $280.