Bears have come back to the game, according to the CoinMarketCap ranking.
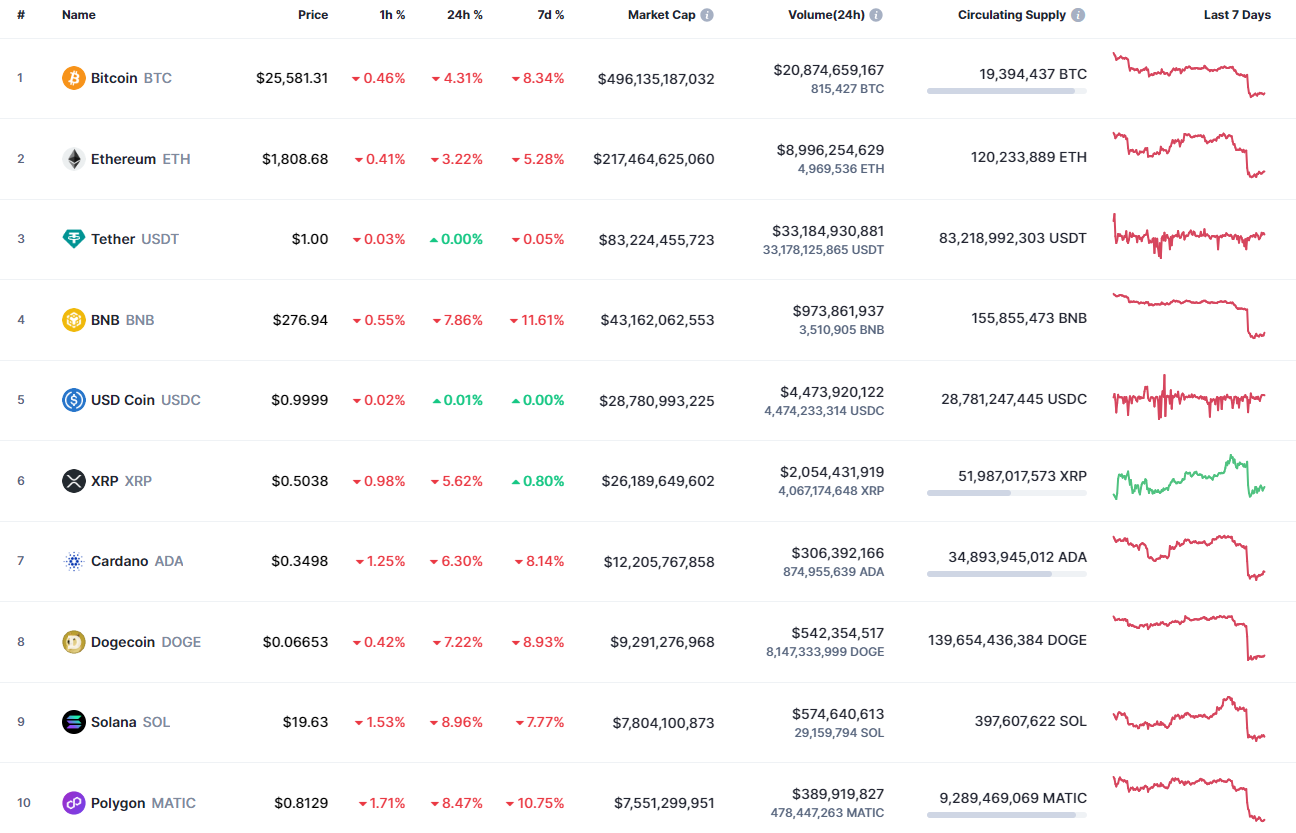
Top coins by CoinMarketCap
SHIB/USD
The rate of SHIB has fallen by almost 5% over the last 24 hours.
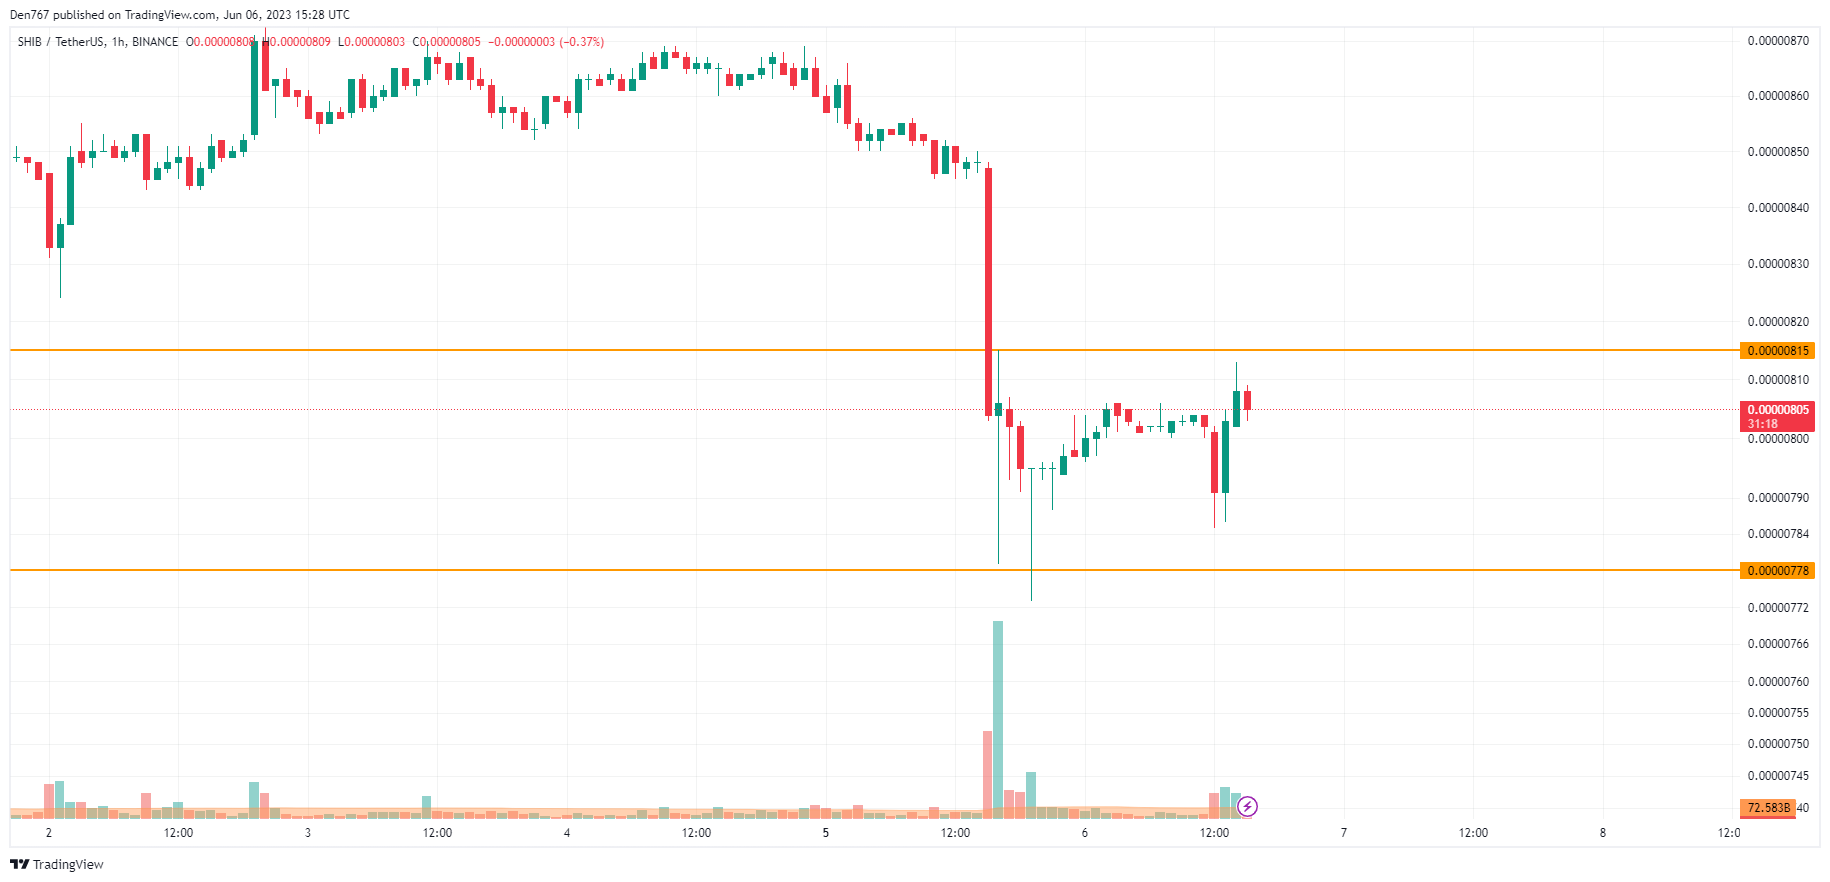
Image by TradingView
On the hourly chart, the rate of SHIB is trading in the middle of the local channel, accumulating power for a further move. If the closure happens near the $0.00000810 mark, there is a chance to see a resistance breakout, followed by a blast to the $0.00000840 area.
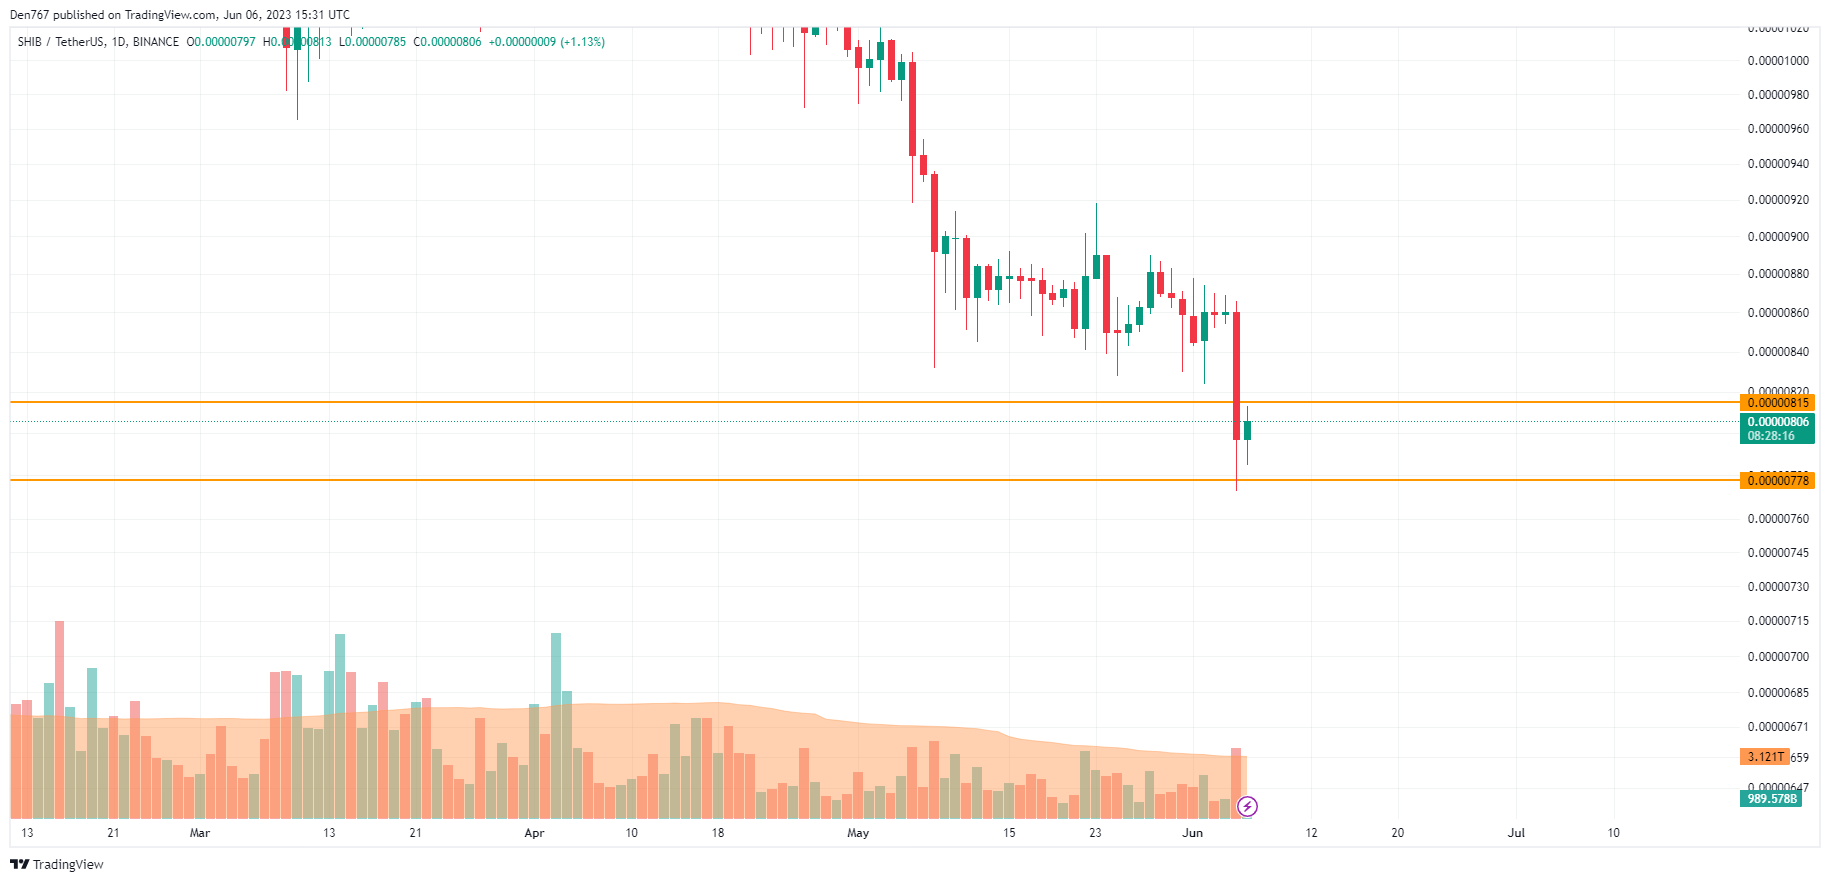
Image by TradingView
On the bigger chart, the price is fighting for the important zone of $0.000008. Currently, one should focus on that area. If the bar closure happens above that area, there is a chance to see a bounce back to the $0.000009 range.
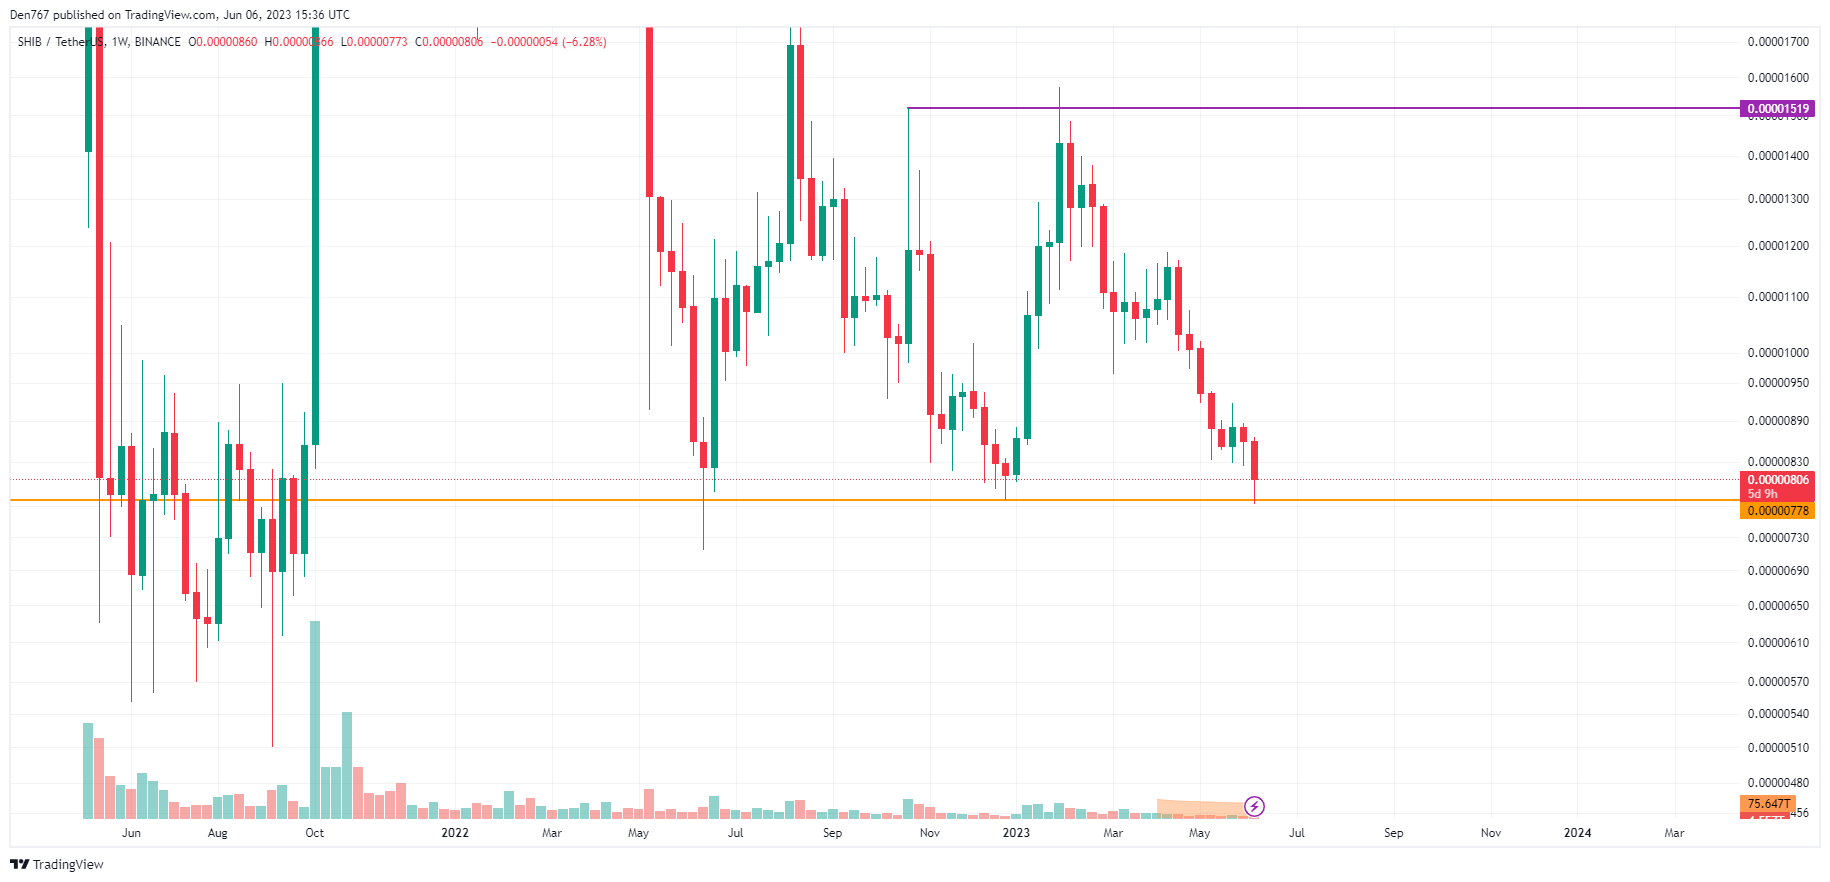
Image by TradingView
From the midterm point of view, the rate of SHIB has made a false breakout of the support at $0.0000778.
However, if the bar closes near that mark, the accumulated energy is supposed to be enough for a more profound decrease to the $0.000007 area.
SHIB is trading at $0.00000806 at press time.