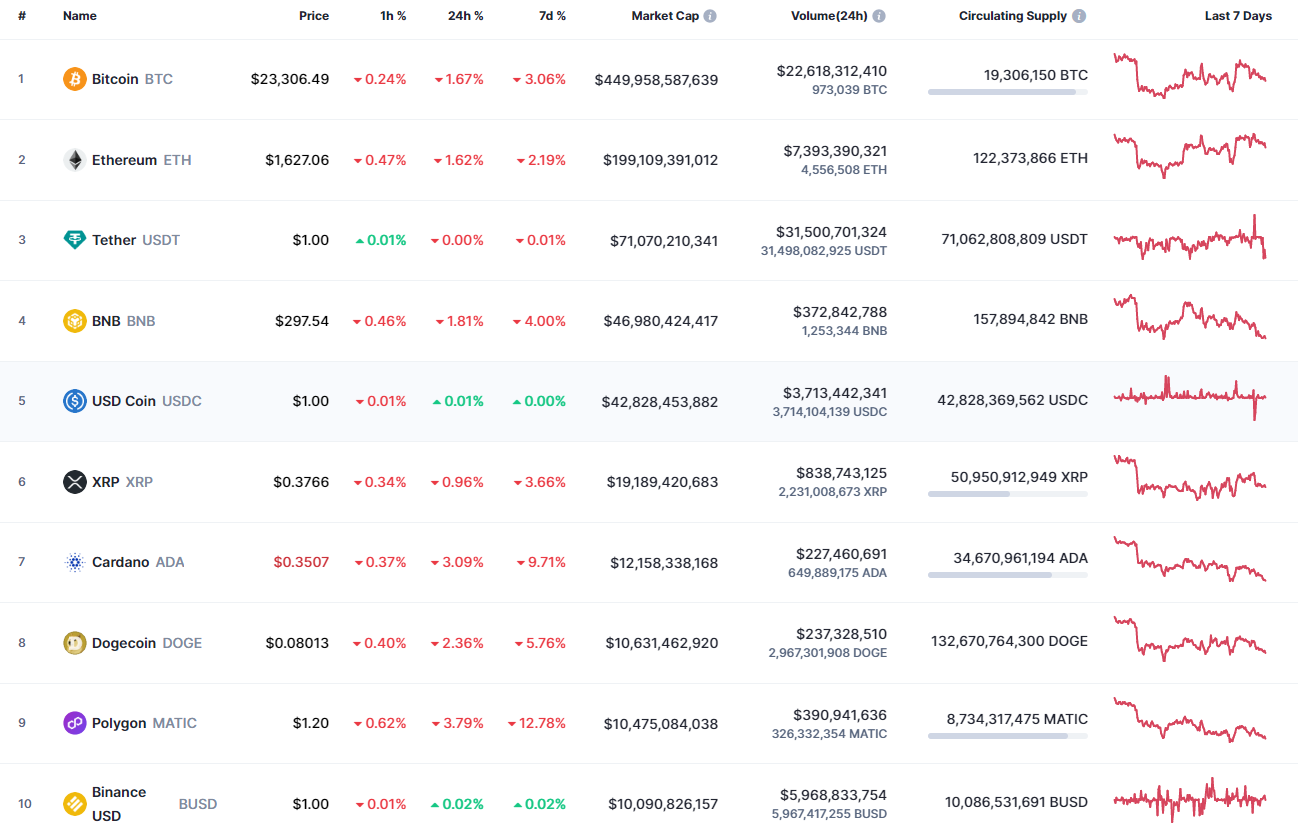
Bears have returned to the game, according to the CoinMarketCap ranking.
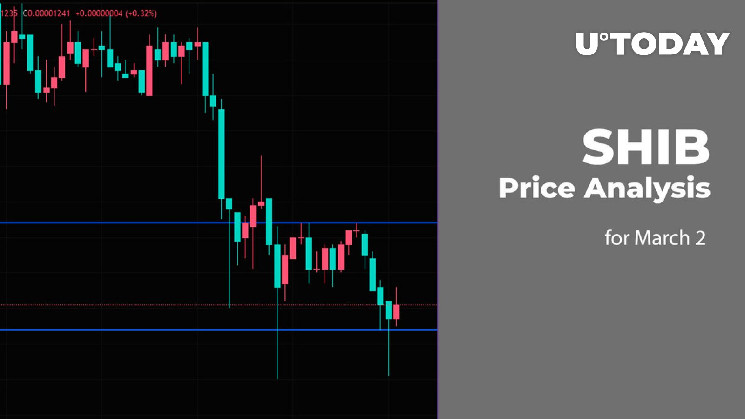
SHIB/USD
SHIB has followed the decline of most of the other coins, going down by 3.52%.
SHIB/USD chart by TradingView " src="https://cnews24.ru/uploads/211/2116509ec68d2322196614b106d992dac5a8dfb7.png" size="1818x830">
Despite sellers' pressure, the price of SHIB has made a false breakout of the recently formed support level at $0.00001183. If the bar closes above it, bulls have a chance to bounce back to the $0.000012 zone.
SHIB/USD chart by TradingView " src="https://cnews24.ru/uploads/0ac/0ac9c0b4bd0c2157fc880c02b89026b7d532c0a6.png" size="1818x830">
On the bigger time frame, the price is approaching the support at $0.00001170. That level plays a key role for bulls in terms of a possible rise. If they lose it, the accumulated energy can be enough for a downward move to the $0.000011 zone.
SHIB/USD chart by TradingView " src="https://cnews24.ru/uploads/4c9/4c9870333cc576297b20b617e292974220dfb5f5.png" size="1818x830">
From the midterm point of view, SHIB is about to close below the previous candle low at $0.00001198. If that happens, the decline may continue to the test of the $0.000010 mark.
Such a scenario is relevant until the end of the month.
SHIB is trading at $0.00001190 at press time.