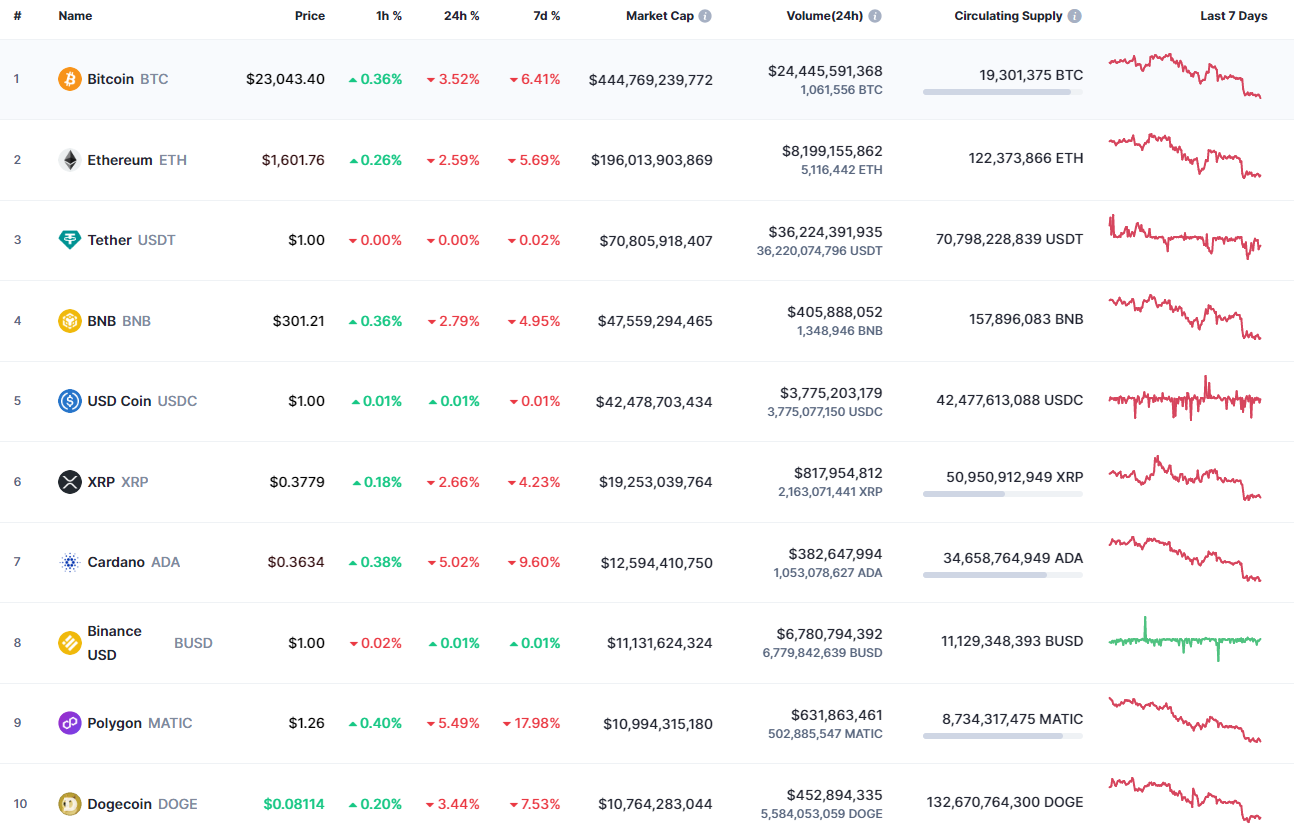
Bears remain more powerful than bulls as the rates of coins keep falling.
SHIB/USD
The price of SHIB has fallen by almost 5% over the past 24 hours.
SHIB/USD chart by TradingView " src="https://cnews24.ru/uploads/e81/e81b3c7f1f352b879e01532bd8020a7e6d1d598a.png" size="1823x855">
On the hourly chart, the price of SHIB has bounced off the local support level at $0.00001234. While the rate is above it, a correction is possible to the middle of the channel, to around the $0.00001250 zone.
However, if that does not happen, a breakout of $0.00001234 may be a prerequisite for a fall to the $0.000012 area.
SHIB/USD chart by TradingView " src="https://cnews24.ru/uploads/965/96580dea12e108c763f9e8ddedd042abbfd75661.png" size="1823x855">
Bears are also more powerful than bulls on the daily time frame. If the bar closes near the support at $0.00001209, the decline may continue to the zone of $0.000011-$0.00001150 next week.
SHIB/USD chart by TradingView " src="https://cnews24.ru/uploads/9e4/9e42a666bcaab7351ce24fd9ab63eabea0ede56b.png" size="1823x855">
From the midterm point of view, SHIB is neither bullish nor bearish as the price is located in the middle of the channel between the support at $0.00001086 and the resistance at $0.00001519. As neither side has accumulated enough strength for further sharp moves, ongoing sideways trading in the range of $0.000012-$0.000013 is the more likely scenario.
SHIB is trading at $0.00001240 at press time.