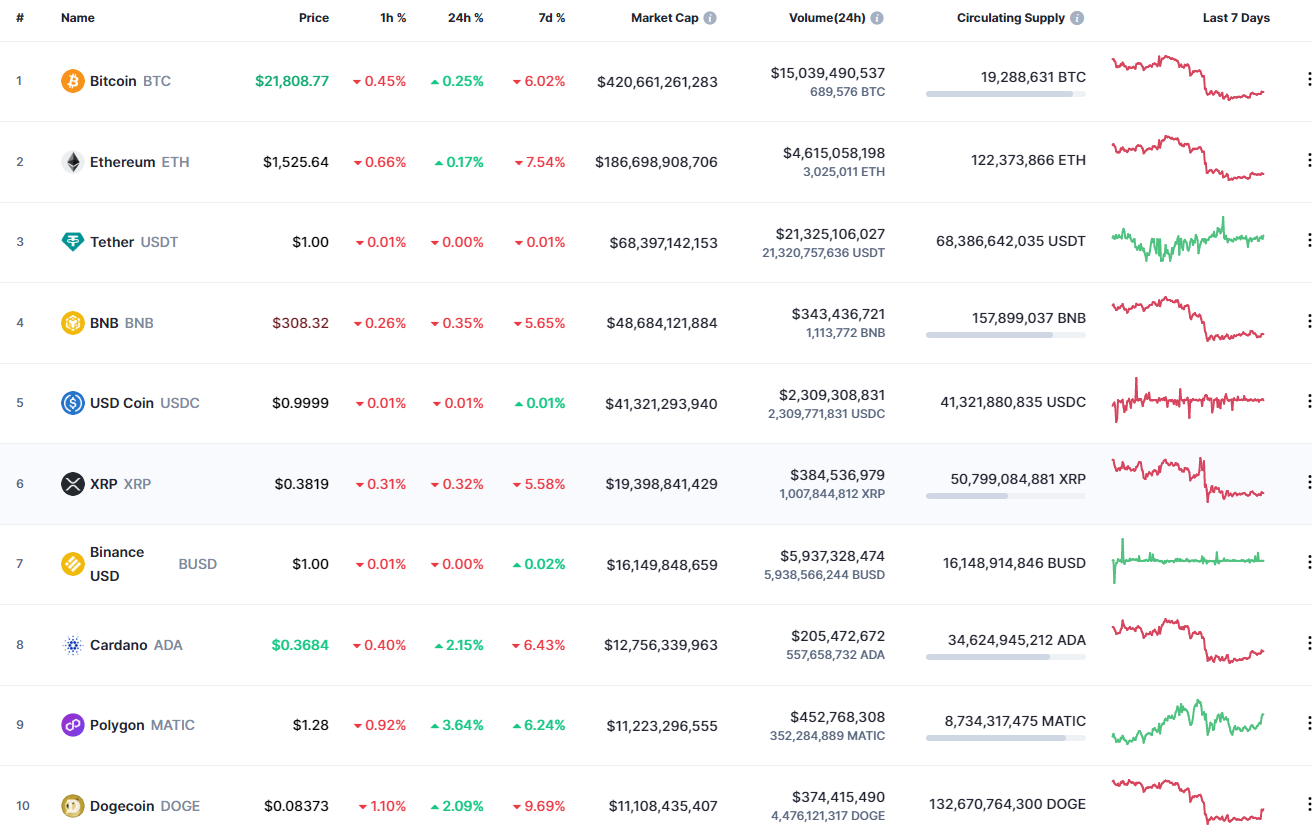
The last day of the week is more bearish than bullish for most of the coins.
SHIB/USD
While the rates of other coins are falling, the price of SHIB has increased by 1.88% over the last 24 hours.
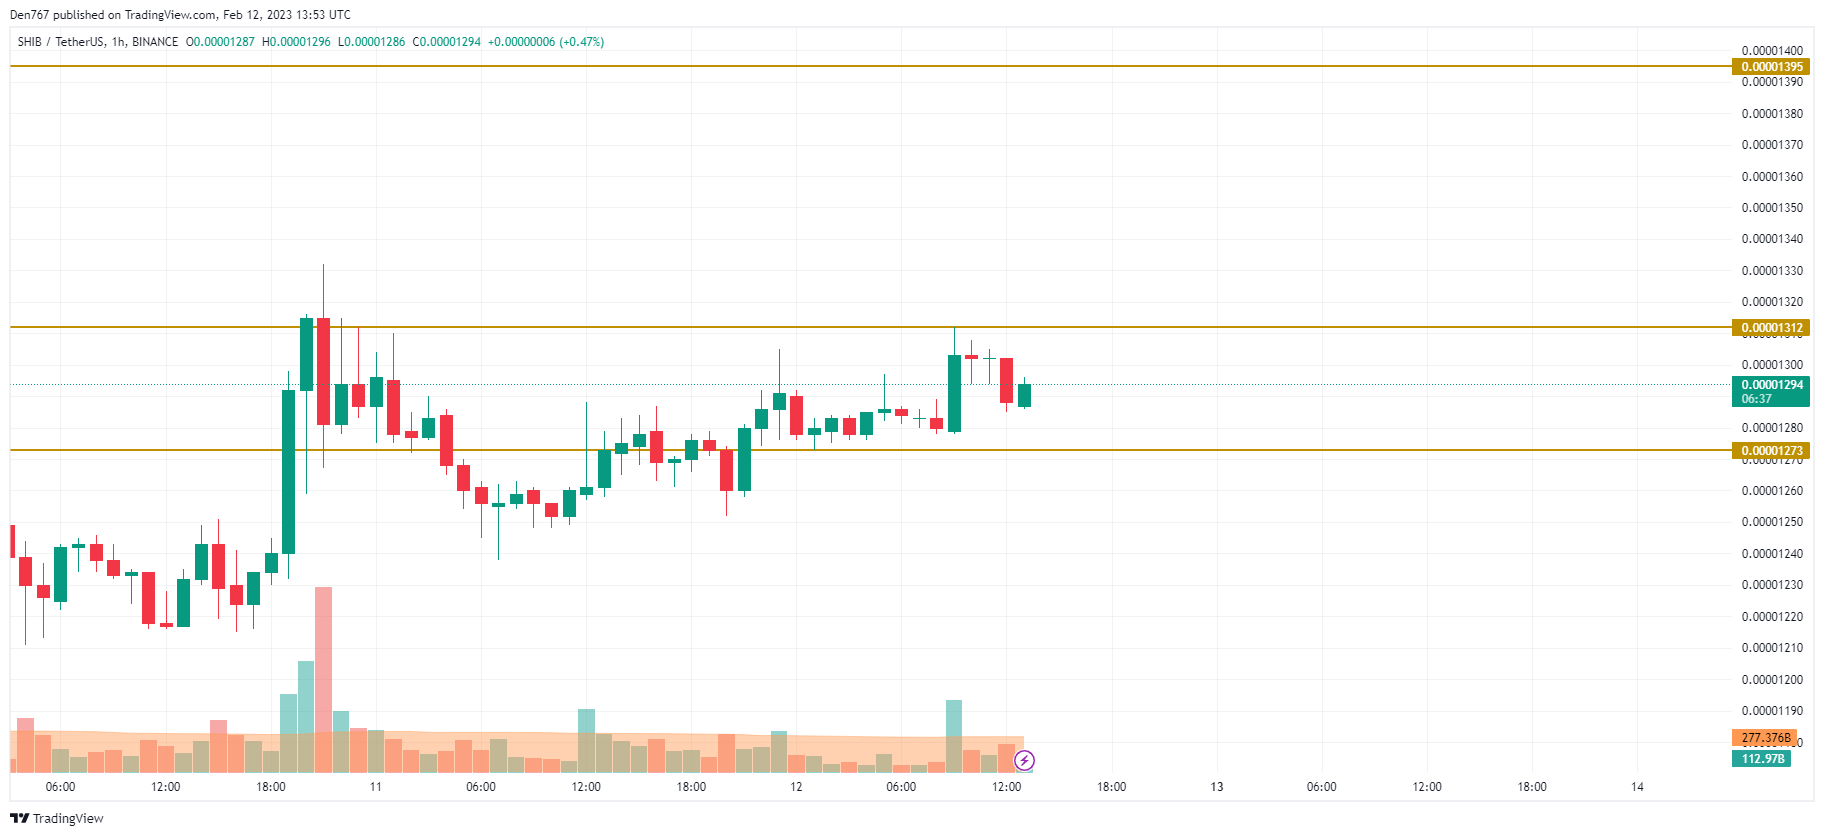
On the local chart, SHIB is neither bullish nor bearish as the price is located in the middle of the channel between the support at $0.00001273 and the resistance at $0.00001312. Buyers might think about further growth only if they can fix the price above the $0.000013 zone.
On the bigger time frame, the price of SHIB has bounced back from yesterday's peak at $0.00001310. However, one should pay attention to the closure of the candle.
If it happens near the level and with no wicks, traders might see a price blast tomorrow followed by growth to the $0.00001350 mark.
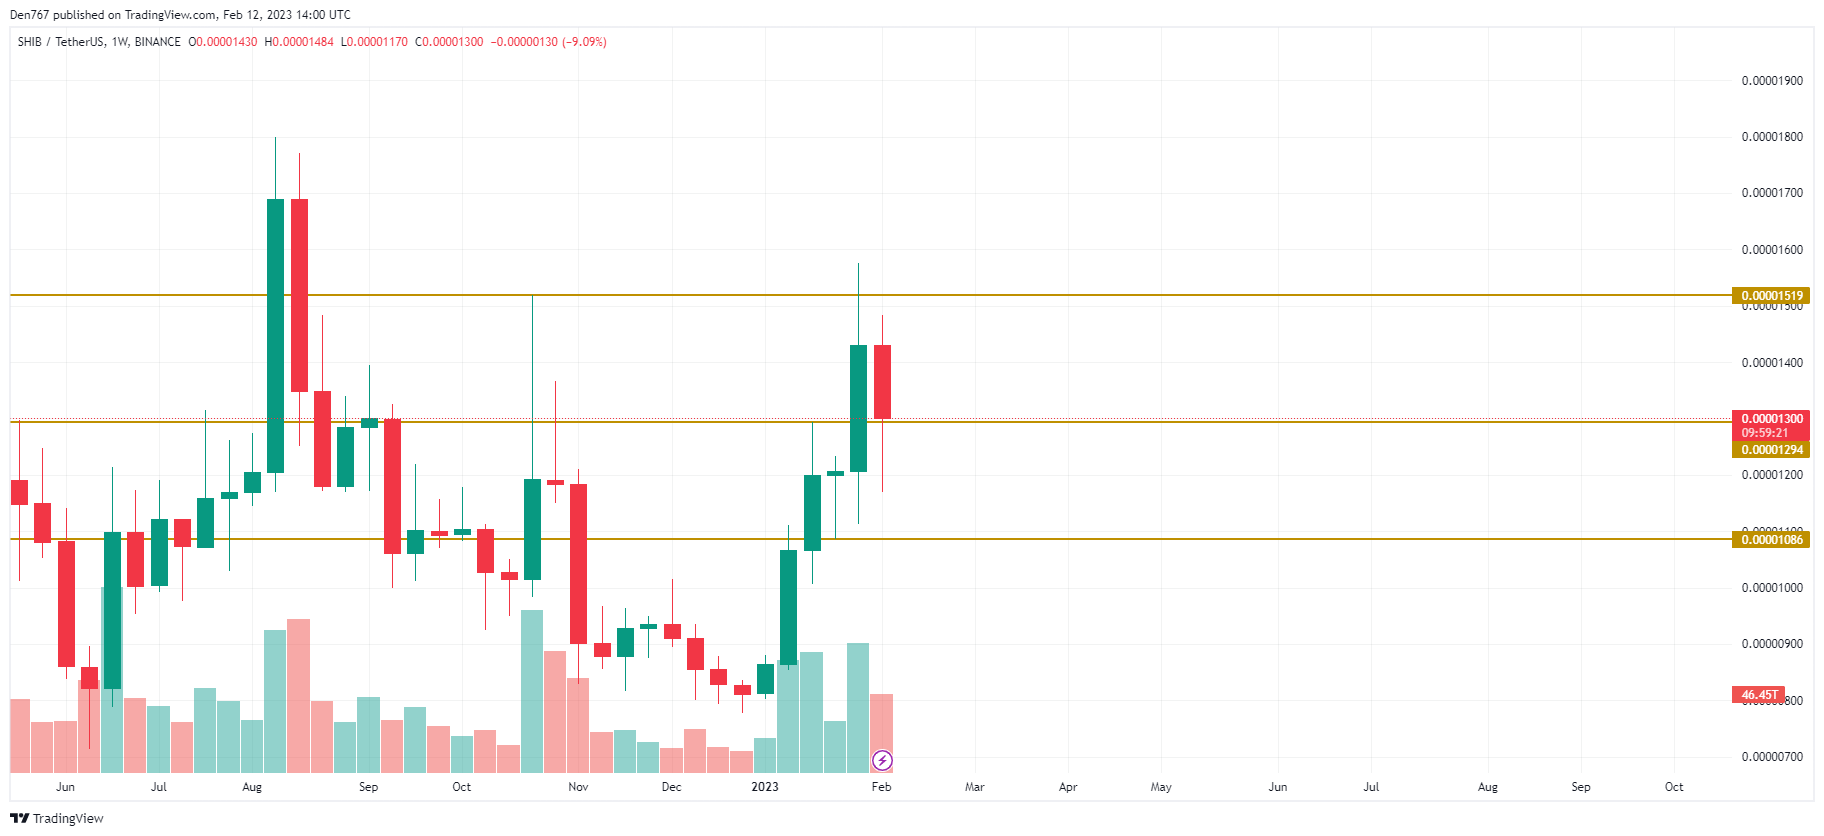
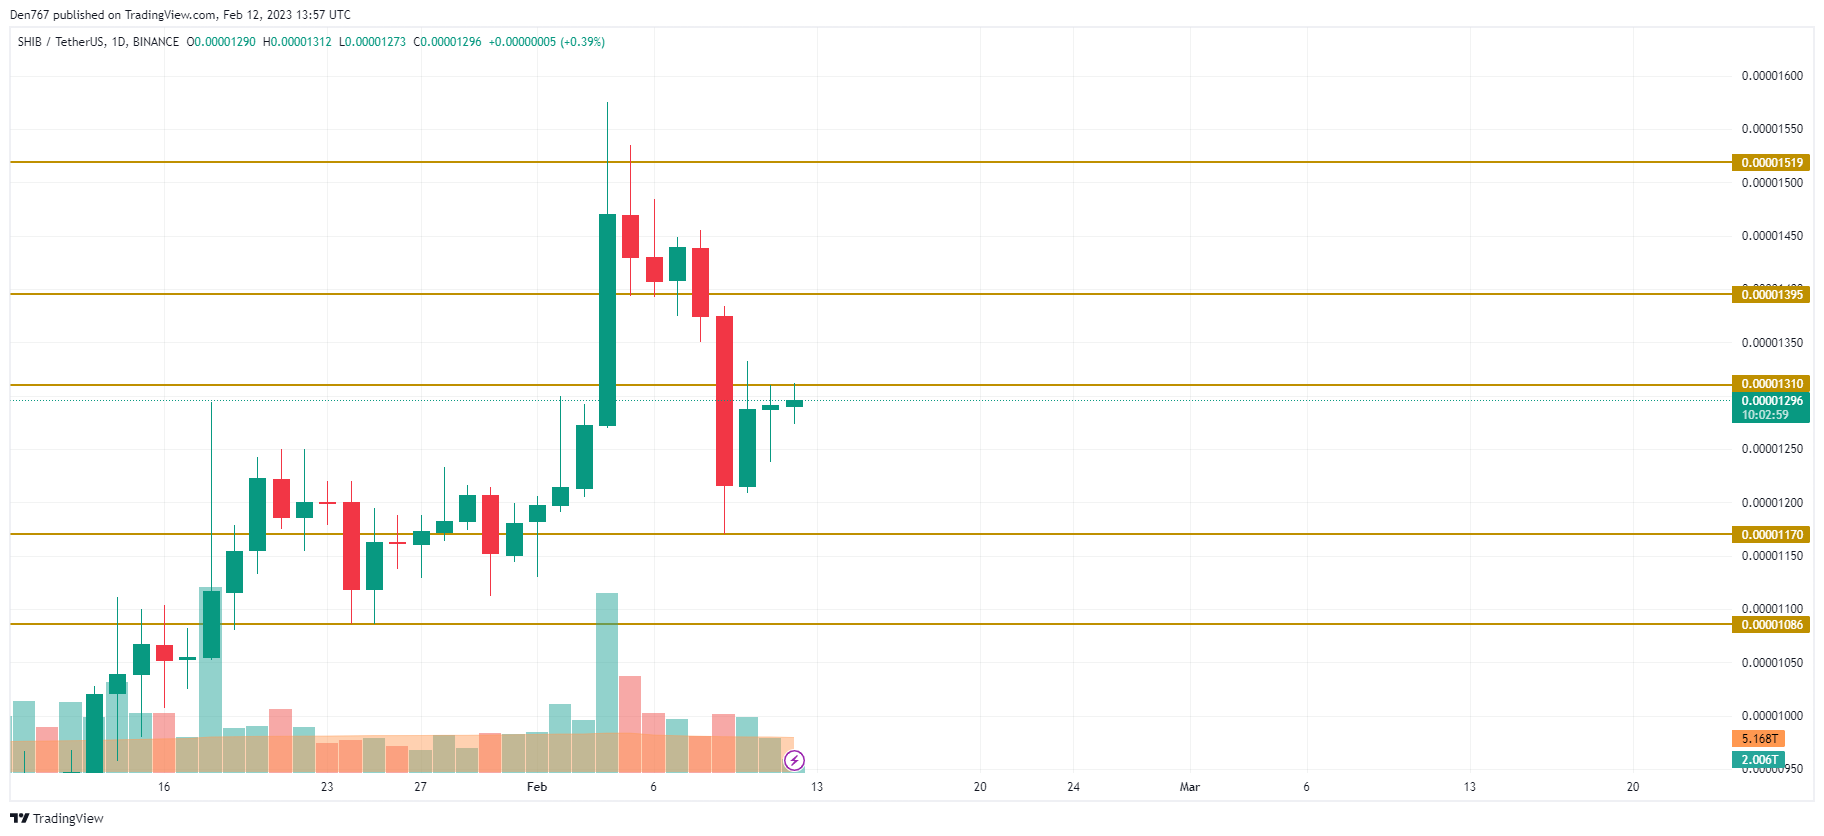
On the weekly chart, SHIB is trying to form a false breakout of the formed support at $0.00001294. If buyers manage to do that and the bar closes above that mark, there is a chance to see local growth to the $0.00001350 zone.
SHIB is trading at $0.000013 at press time.