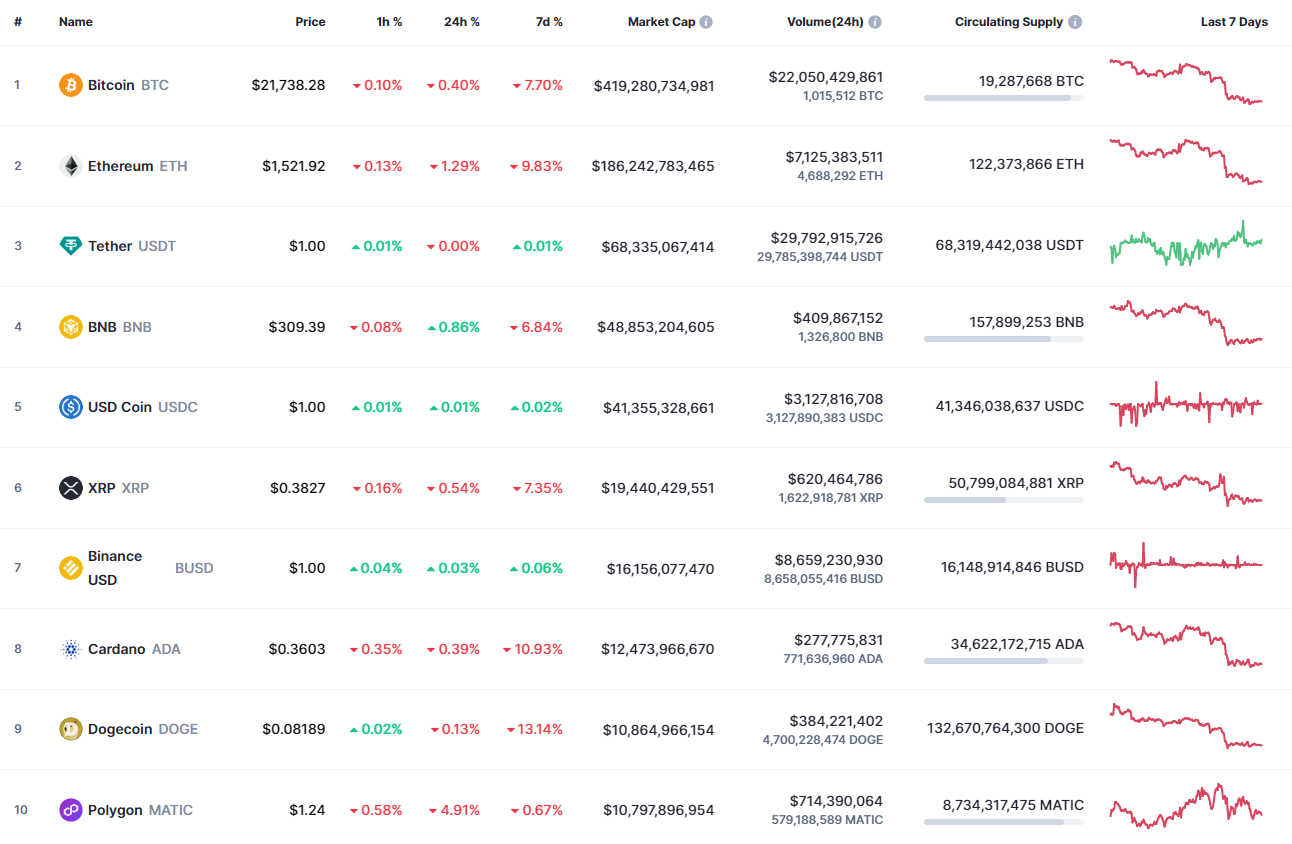
Bulls do not seem ready to keep the coins growing, according to CoinMarketCap data.
XRP/USD
XRP has followed the decline of Bitcoin (BTC), going down by 0.54%.
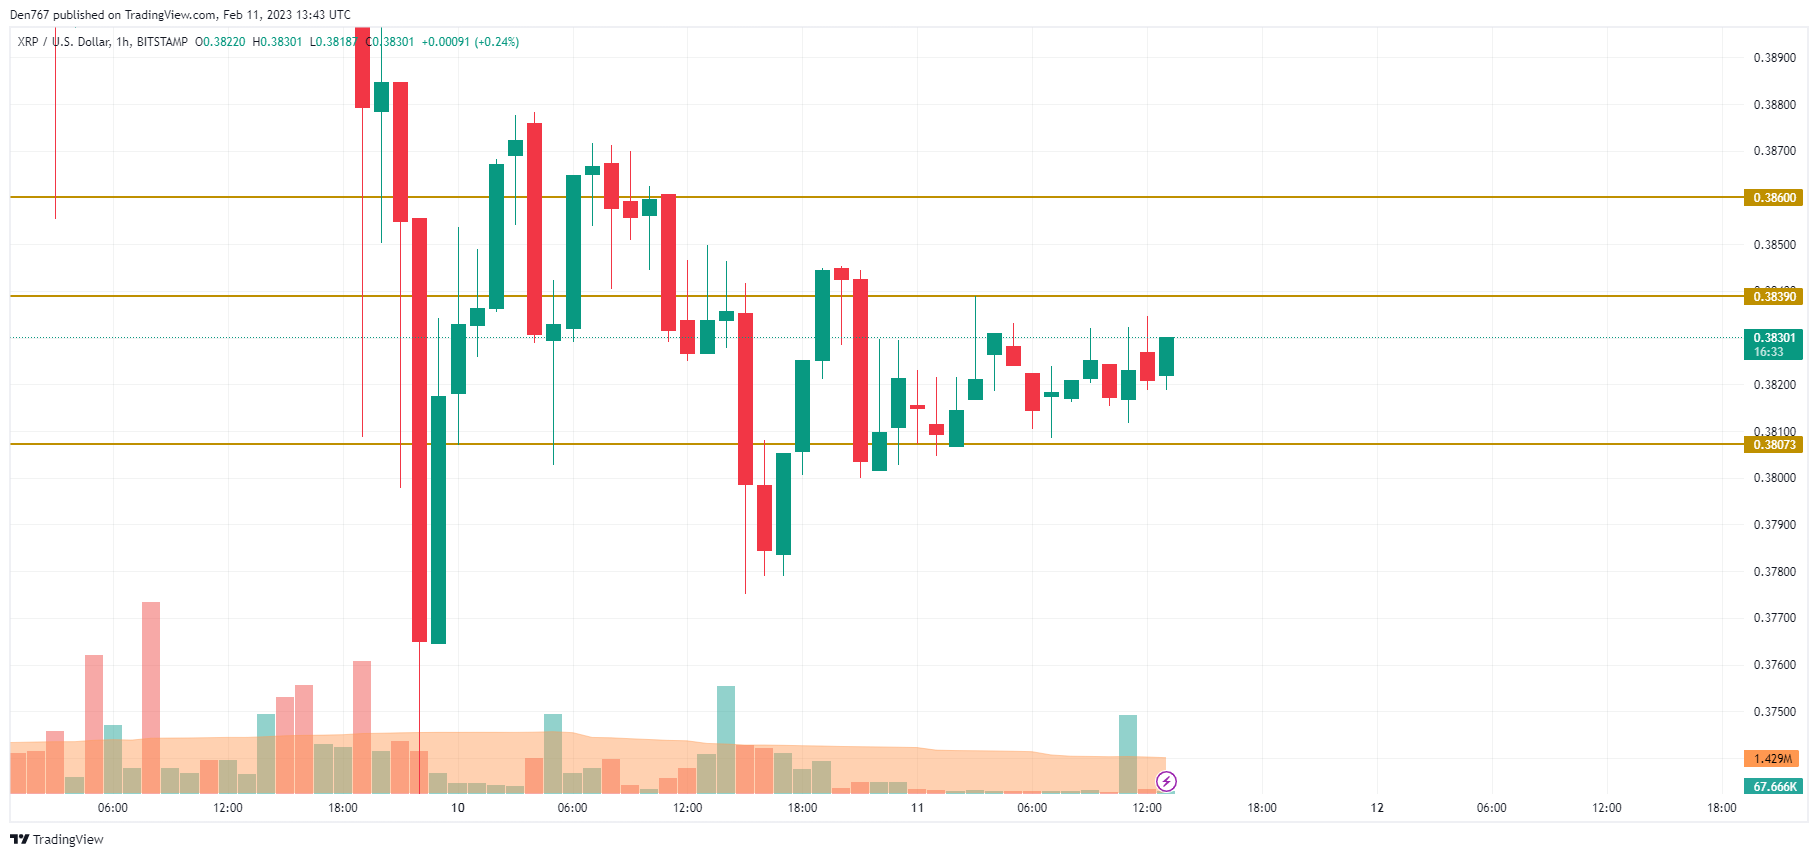
Despite today's drop, XRP is looking quite positive on the local time frame as the rate is trying to fix above the $0.38 mark. If bulls manage to do that, there is a high chance to see a breakout of the resistance followed by an impulse to the $0.3850 area.
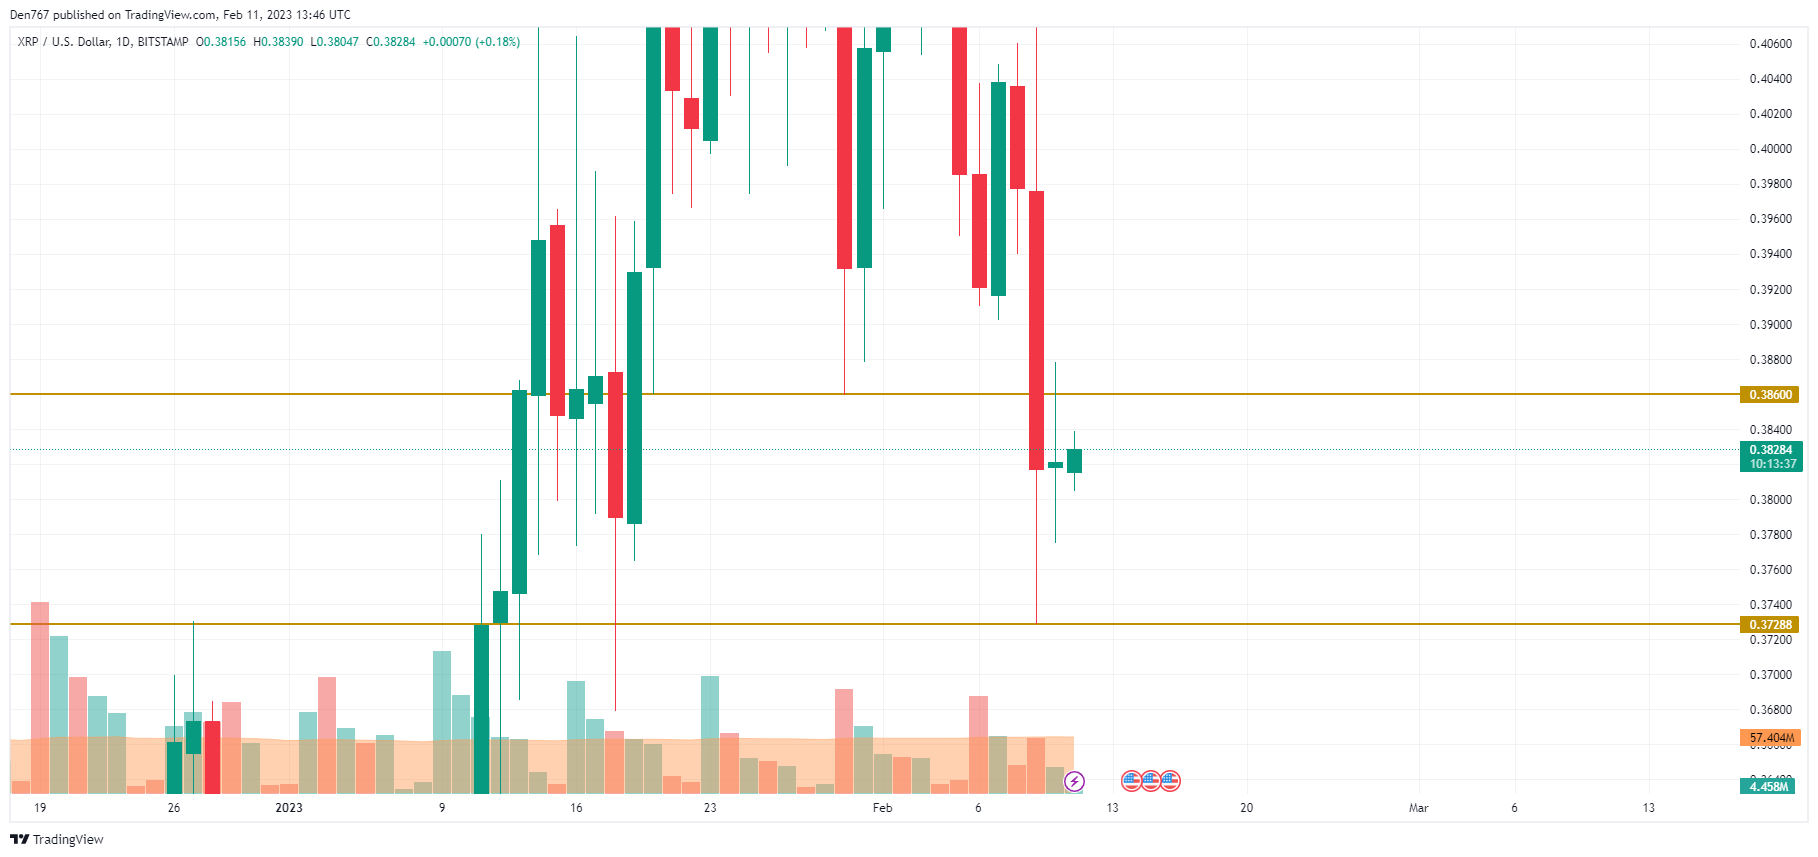
On the daily chart, XRP might have entered an accumulation phase after the sharp drop. In this case, the more likely scenario is sideways trading in the narrow range of $0.38-$0.3850 so the altcoin could get more energy for a further move.
From the midterm point of view, the price is below the nearest support level at $0.3860, which means that there is a higher chance to see a further decline than a bounce back.
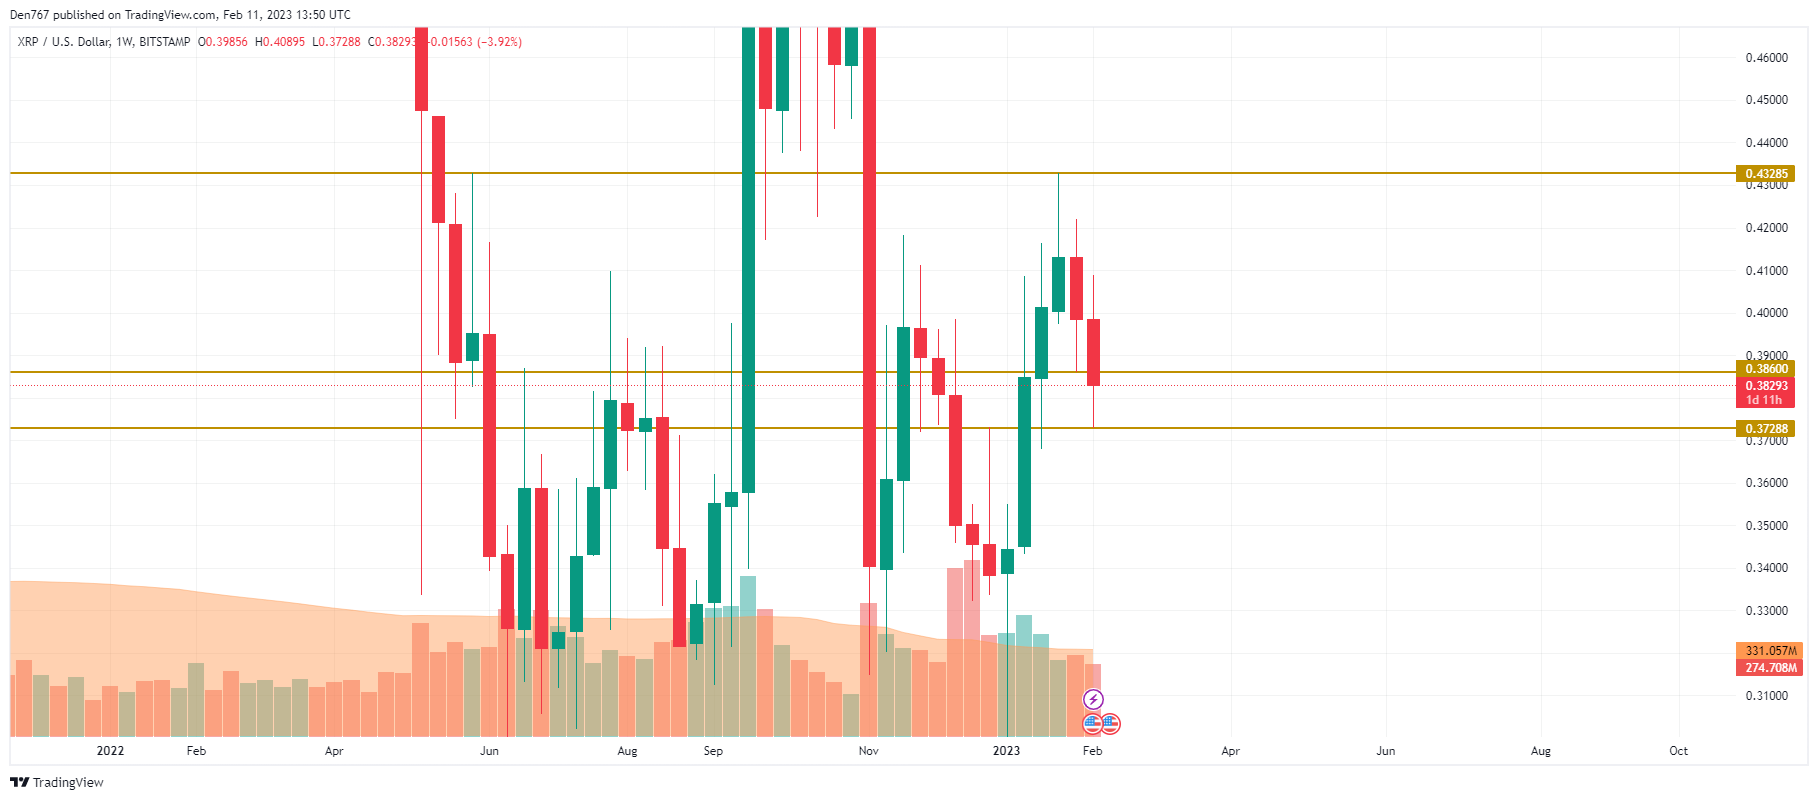
However, if a false breakout happens, bulls could seize the initiative and bring the rate back to the $0.40 area.
XRP is trading at $0.3829 at press time.