- The token has shown bullish actions in previous sessions.
- 50 and 200 EMA are on the verge of bullish crossover.
The cryptocurrency market crashed again in 2022, and XMR was not exempt from suffering losses throughout the year. The currency originally did rather well, peaking at $288.82 on 22 April. However, after that, things started to go south, and on 19 June 2022, it hit a low of $97.23, its lowest price since September 2020. After that, the token showed signs of recovery, and as of the time of writing on January 17, 2023, it was trading at $170.9.
XMR breaks resistance level on daily time frame
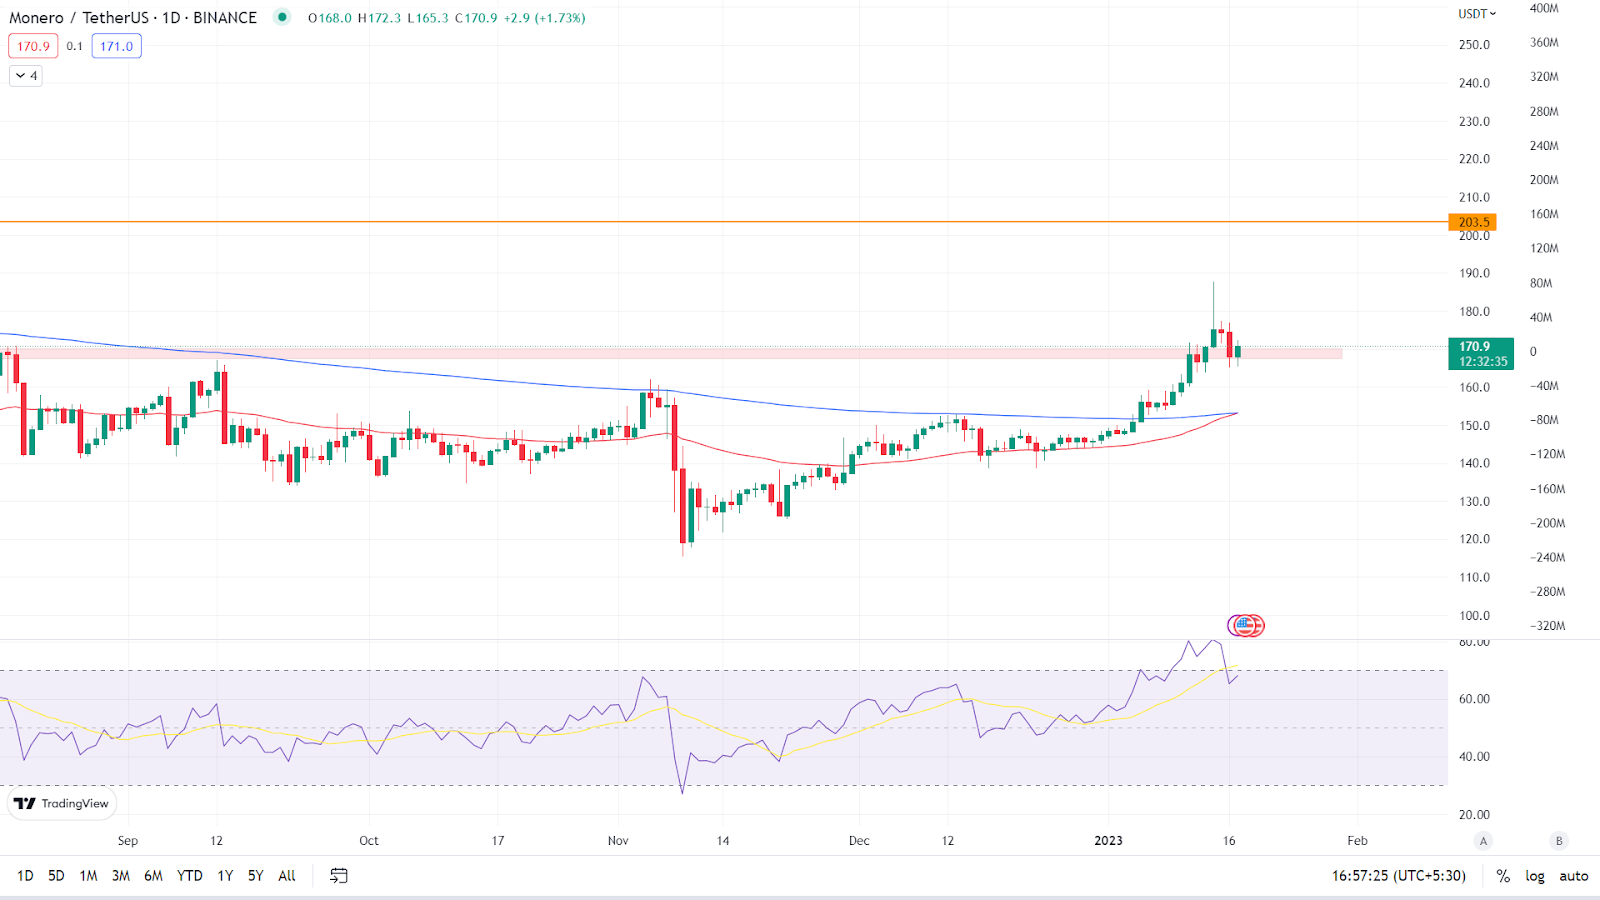
Over the past few days, the token has shown bullish momentum and has broken over the resistance level on the daily time frame. As we can see on the daily chart, XMR token is currently trading at $170.9 with a gain of 1.73% in the past 24 hours. It is trading above the 50 EMA and 200 EMA, which are its key Moving Averages. (The blue line is 200 EMA, the red line is 50 EMA.) EMAs are on the verge of giving a bullish crossover. When the 50 EMA crosses the 200 EMA higher, it is a bullish crossover.
Relative Strength Index: The asset’s RSI curve, which is currently trading at 68.01, indicates that it is in the overbought zone. The value of the RSI curve has risen as a result of the coin breaking above the resistance level with positive momentum. If the bullish momentum continues we can see the RSI curve to remain in the overbought zone in the coming days.
Analyst view & Expectations
The token has broken through the resistance level and is now doing a retest. Investors can buy the token now because it appears to be in a good position. Whereas, intraday traders also have a good opportunity to go long and book profits as per their risk to reward ratio.
According to our current Monero price prediction, the value of Monero is expected to climb by 0.19% in the coming days, reaching $ 171.33. Our technical indicators indicate that the current sentiment is bullish, with the Fear & Greed Index reading 51. (Neutral). Over the previous 30 days, Monero had 19/30 (63%) green days and 6.42% price volatility. According to our Monero forecast, now is a good time to buy Monero.
Technical Levels
Major support: $164.5
Major resistance: $203.5
Conclusion
According to the price action, the token has recovered with significant bullish momentum, forming a bullish chart pattern. Investors’ returns on investment have increased, and new investors who want to invest can do so now.
Disclaimer: The views and opinions stated by the author, or any people named in this article, are for informational ideas only, and they do not establish the financial, investment, or other advice. Investing in or trading crypto assets comes with a risk of financial loss.