Algorand (ALGO) opened the market for the week with its price of $0.168. For the first couple of days (December 27 and 28), ALGO traded in the green zone fluctuating between the $0.162 and $0.174 range, as shown in the chart below. However, following this short stay in the green zone ALGO tanked into the red zone and recorded its lowest price of $0.161.
Early into December 31, ALGO gained some momentum from the bulls and reached the green zone. Since then, ALGO has been able to retain the position that it gained. The bulls pushed ALGO as it started fluctuating between the $0.168 and $0.182 range. Currency, ALGO is up 3.57% in the last 24 hours and is trading at $0.1814.
ALGO broke the 200-day MA line (yellow line) for the last quarter of 2022 in late October. Ever since then ALGO has been fluctuating under the 200-day MA line. Interestingly, ALGO did not test the 200-day MA even once afterward.
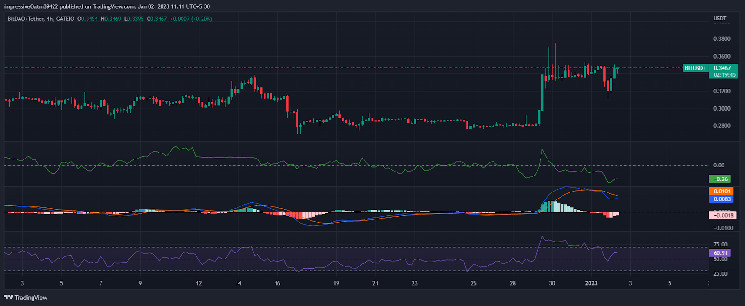
ALGO has touched the upper Bollinger band, hence the market could correct the prices. Moreover, the RSI is at 70.95 in the overbought region, which denotes the same market sentiment and the prices could further tank. This offers a good spot for buyers to enter.
If the bulls push hard, ALGO might be able to test the 200-day MA and then move on to resistance 1 ($0.2200). However, if the bears dominate the market, then ALGO will fall to support 1 ($0.1427).