The Chiliz (CHZ) price is trading above a crucial horizontal support area but does not show any bullish reversal signs yet.
The FIFA World Cup final will be held on Dec. 18, marking an end to the World Cup. Before the event, there were rumblings of a massive price appreciation of CHZ, due to it being a sponsor of the event and various fan tokens being part of the Chiliz ecosystem. Since the start of the Fifa World Cup on Nov. 21, the Chiliz price fell by 27%.
Chiliz Breaks Down From Ascending Support Line
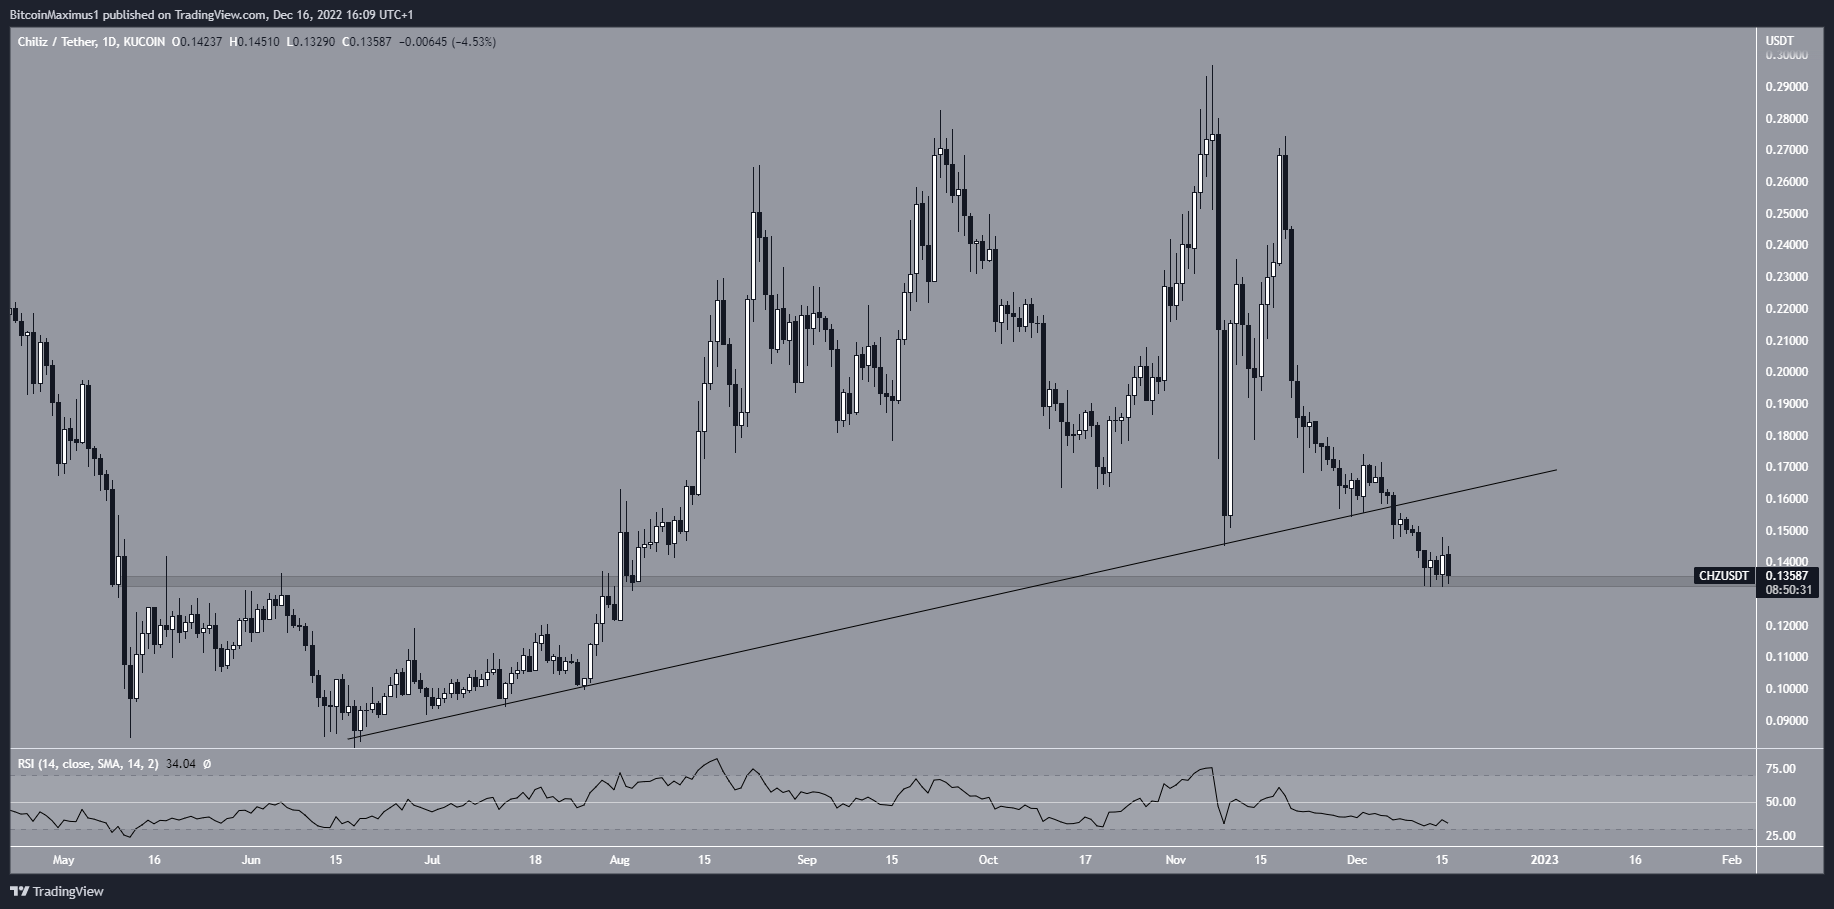
The CHZ price has decreased since Nov. 7. It created a lower high on Nov. 19 before falling sharply. On Dec. 7, it broke down form an ascending support line in place since June. This was a sign that the upward movement came to an end.
After the breakdown, the Chiliz price reached a low of $0.132 before bouncing. This validated the $0.135 horizontal area as support. However, the majority of the bounce was negated in the next 24 hours. Since the $0.135 area is the final support prior to the yearly lows at $0.085, a breakdown below it could accelerate the rate of decrease.
The RSI does not show any bullish reversal signs. It is decreasing, is below 50 and has not generated any bullish divergence yet. As a result, the readings from the daily time frame are bearish.
Is The Correction Complete?
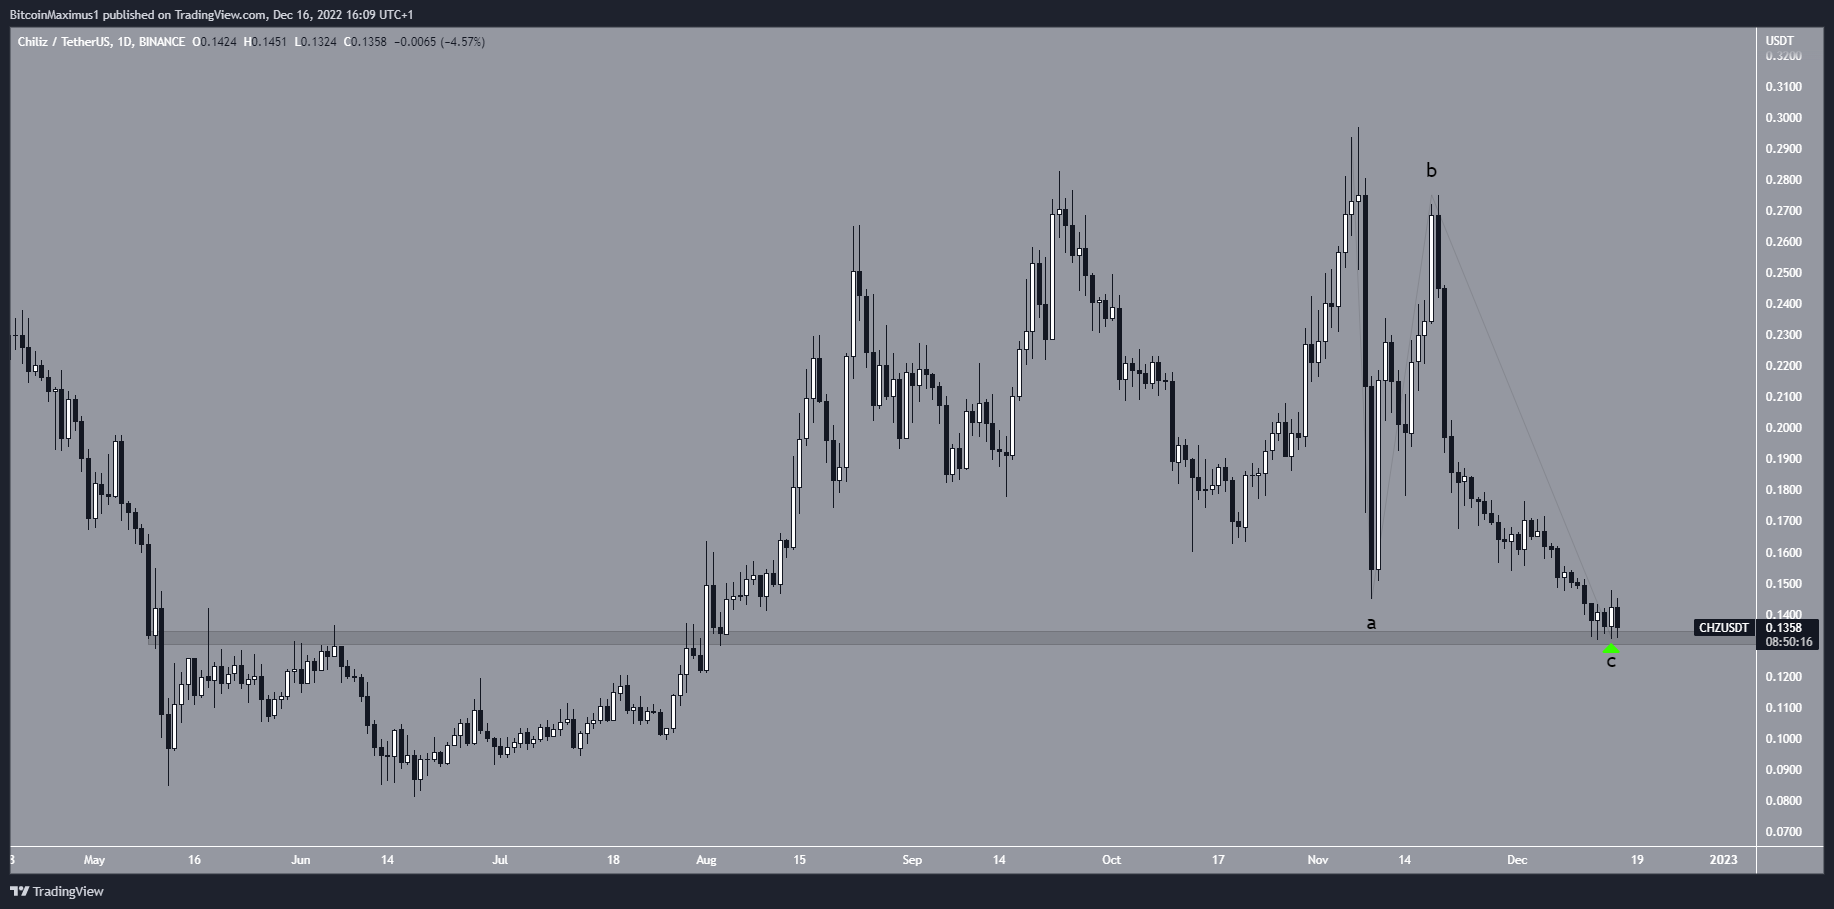
Despite the lack of bullish reversal signs in technical indicators or the price action, the wave count gives some hope to a bullish reversal.
Measuring from Nov. 7, it seems that the CHZ price completed an A-B-C corrective structure, in which waves A:C had an exactly 1:1 ratio. The fact that the move ended at the $0.135 support area further increases its legitimacy. Finally, the bullish engulfing candlestick from Dec. 15 (green icon) further supports the bullish count.
If the count is correct, the CHZ price will soon begin a bullish reversal. On the other hand, a daily close below the $0.135 area would invalidate this bullish hypothesis.
For BeInCrypto’s latest crypto market analysis, click here.