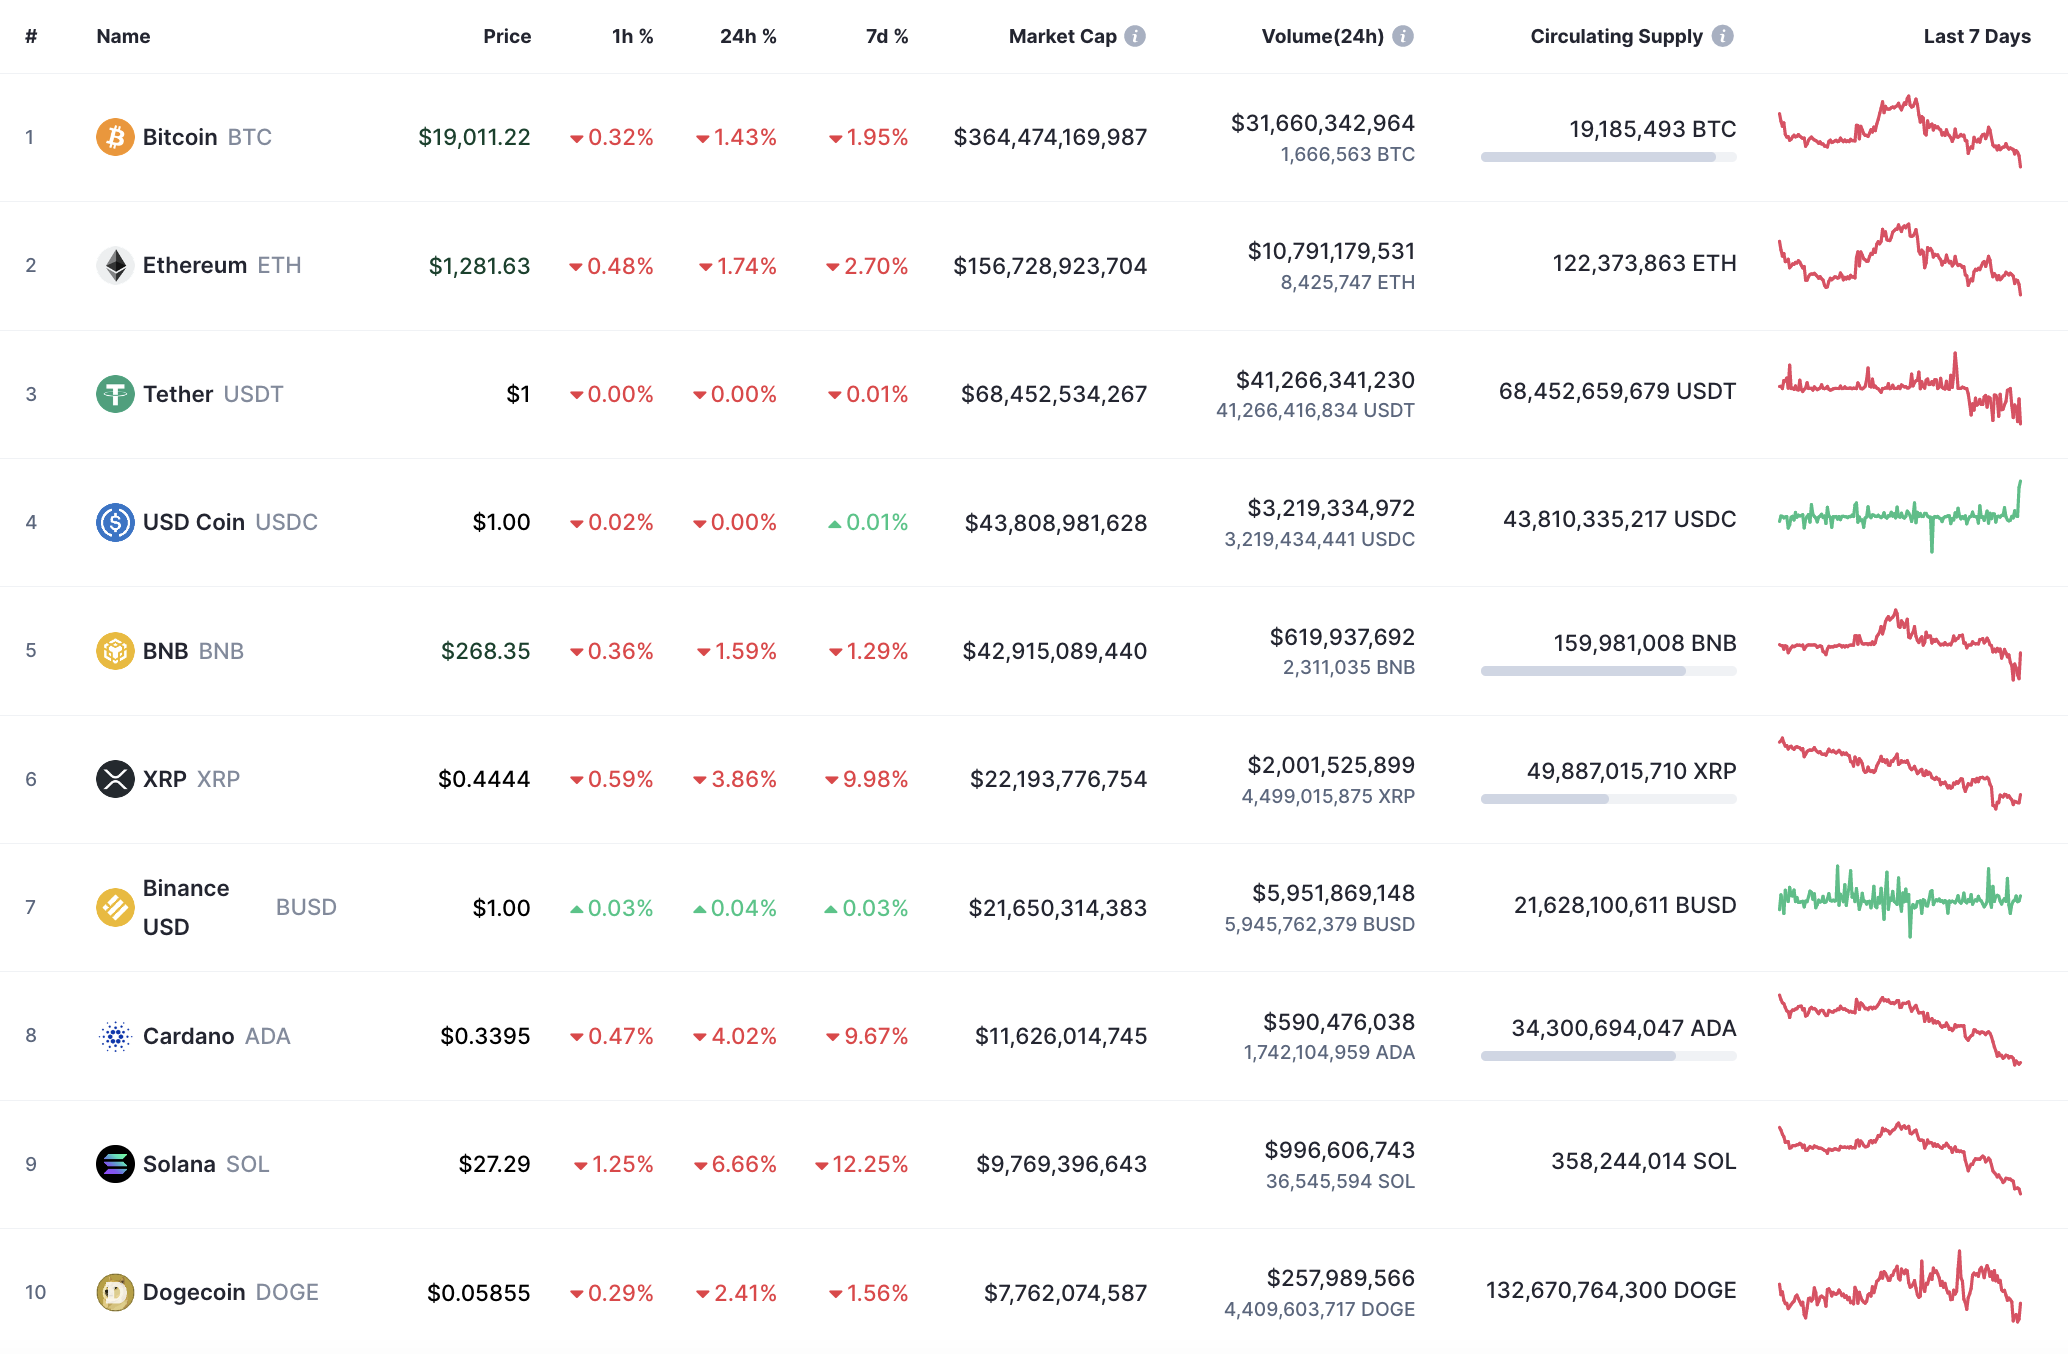
Bulls could not seize the initiative until the end of the day as all of the top 10 coins remain in the red zone.
XRP/USD
XRP has turned out to be more of a loser than Bitcoin (BTC) as the price has dropped by 3.86%.
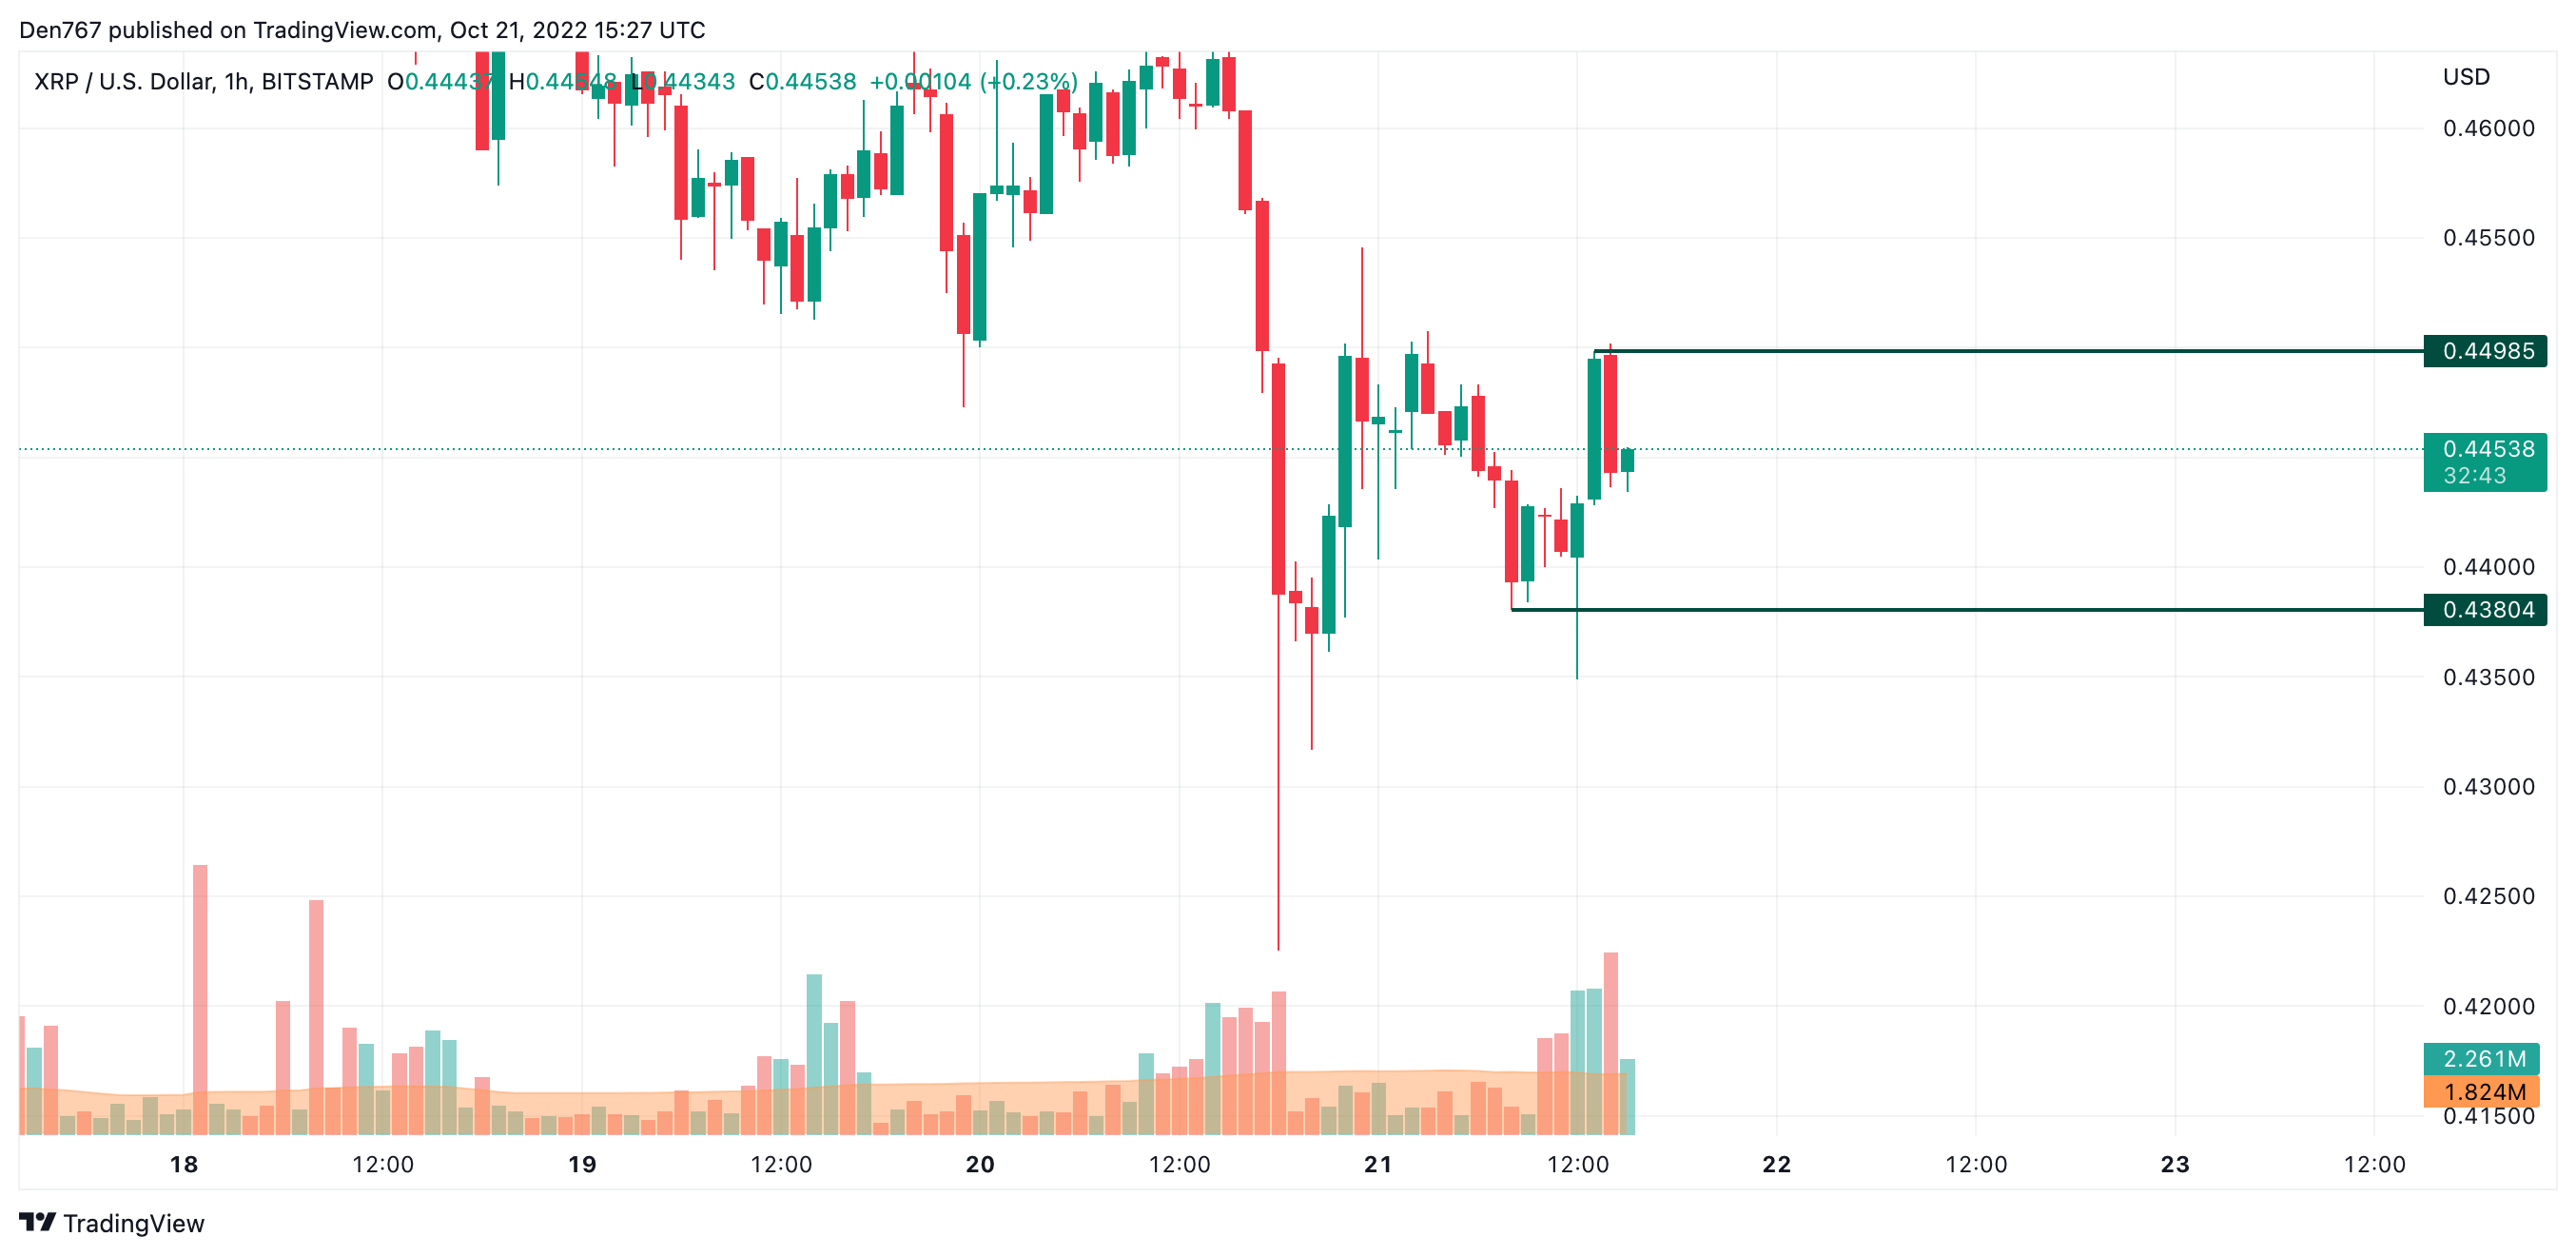
On the hourly chart, XRP has formed a false breakout of the support at $0.43804. At the moment, the price is located in the middle of a narrow channel, which means that one should not expect sharp moves until the end of the day.
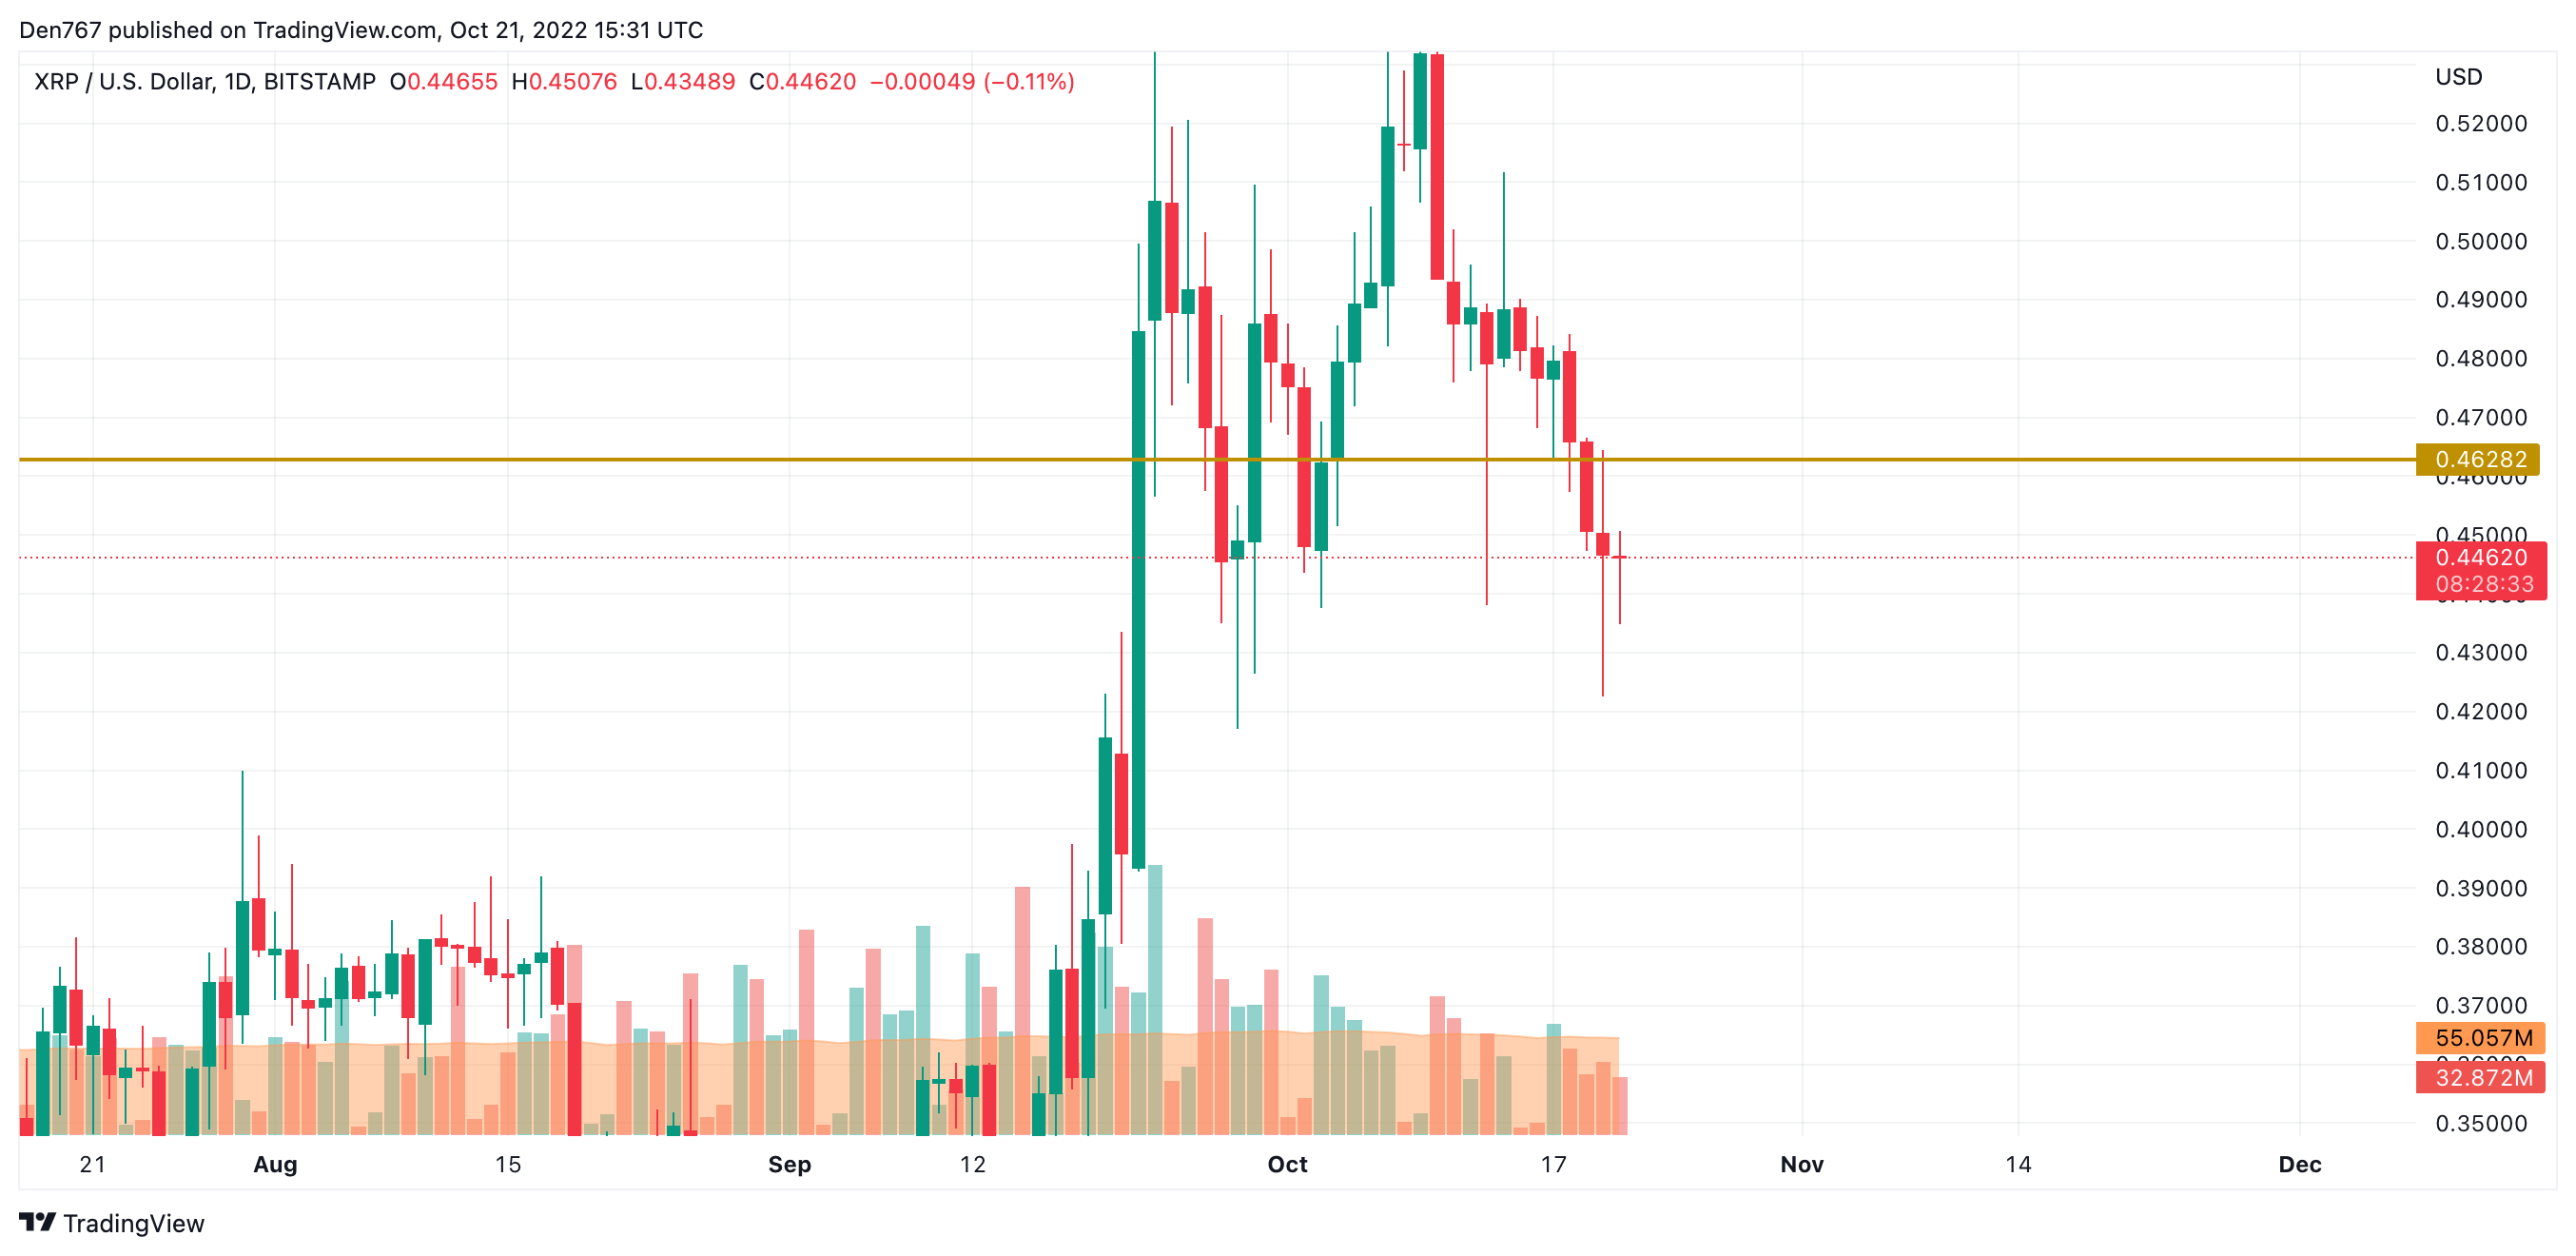
On the daily time frame, nothing is clear yet as XRP keeps accumulating power for a further sharp move. If buyers want to get back in the game, they need to fix above the $0.46 zone.
Only, in that case, there is a possibility of seeing a midterm reversal.
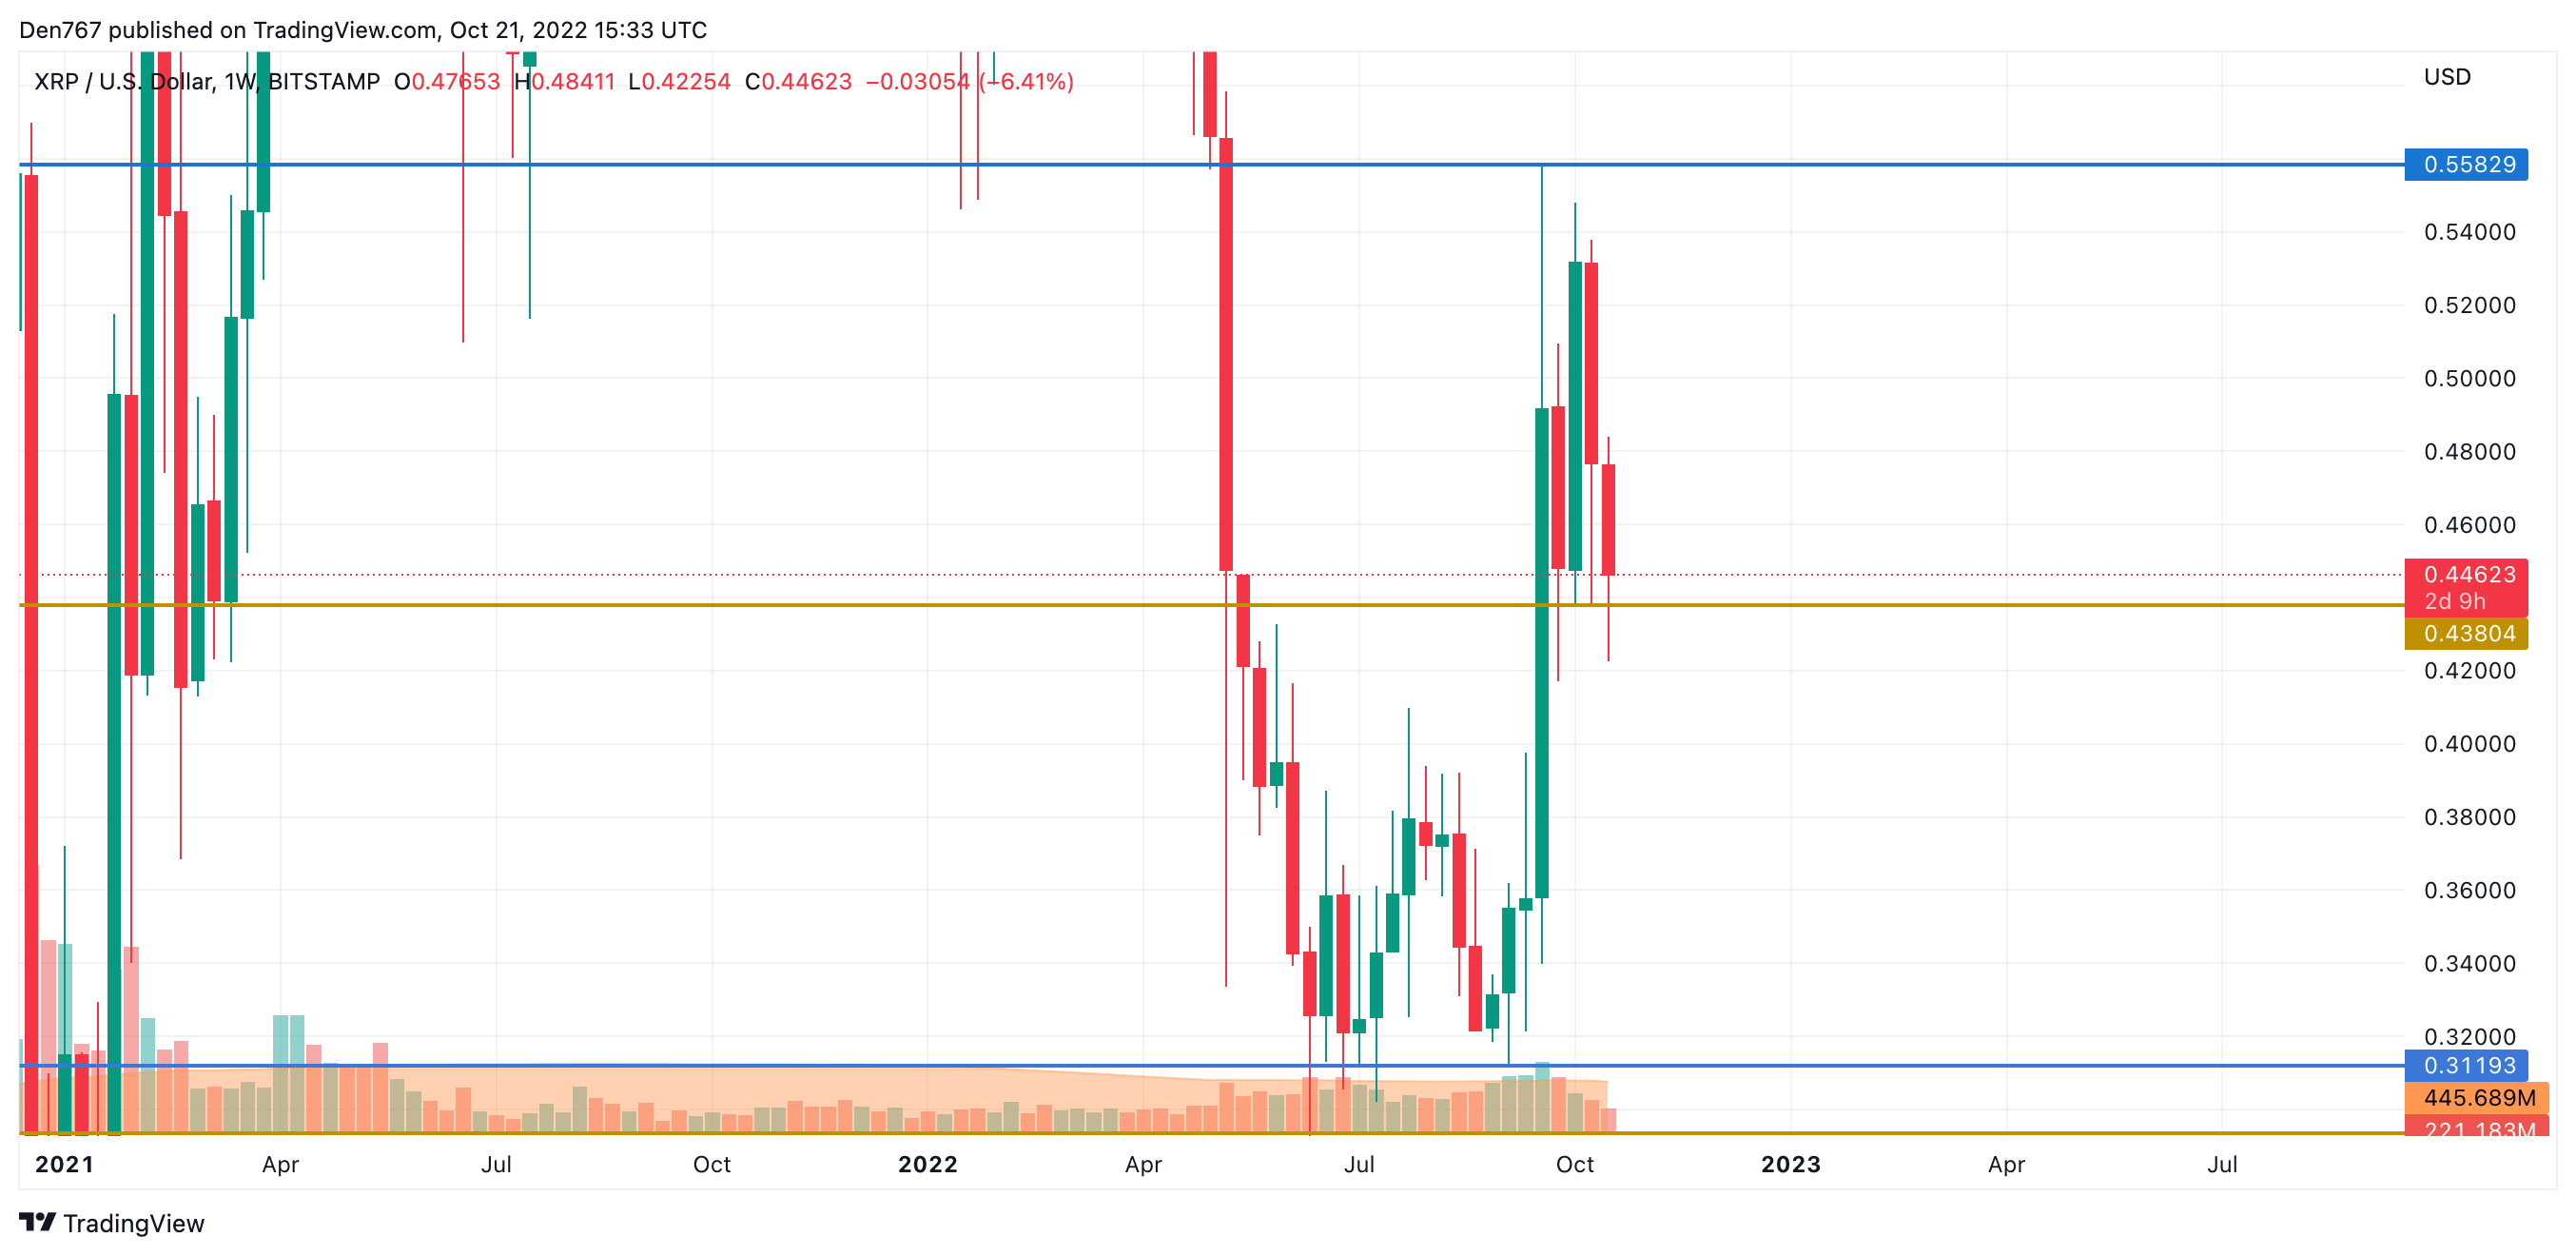
From the weekly chart, XRP has made a false breakout of the support level at $0.43804. If the candle fixes above it, the bounce back may continue next week. If that happens, XRP can reach the $0.48 mark next month.
XRP is trading at $0.4457 at press time.