- Solana price has lost 22% of its market value since mid-September.
- The Volume Profile indicator is still questionable as to who dominates the market.
- Invalidation of the bullish idea is contingent upon a few factors mentioned below.
Solana price could show a bounce soon. Key levels have been identified.
Solana price is a trader's chart
Solana price has day traders watching the bulls closely, attempting to reclaim grounds with the 8-day exponential moving average. The bullish retaliation comes after Solana's recent 22% decline since mid-September. On larger time frames, the Solana price is stair-stepping into support on the Relative Strength Index. Thus, this is a crucial time for the centralized smart contract token and keeping a close eye is justified.
Solana price currently auctions at $32. The downrtrend's power is still up for debate as the Volume Profile Indicator shows a sparse reading. If the bulls can hurdle the 21-day simple moving average at $33.14, then a more confident countertrend trade idea will present itself.
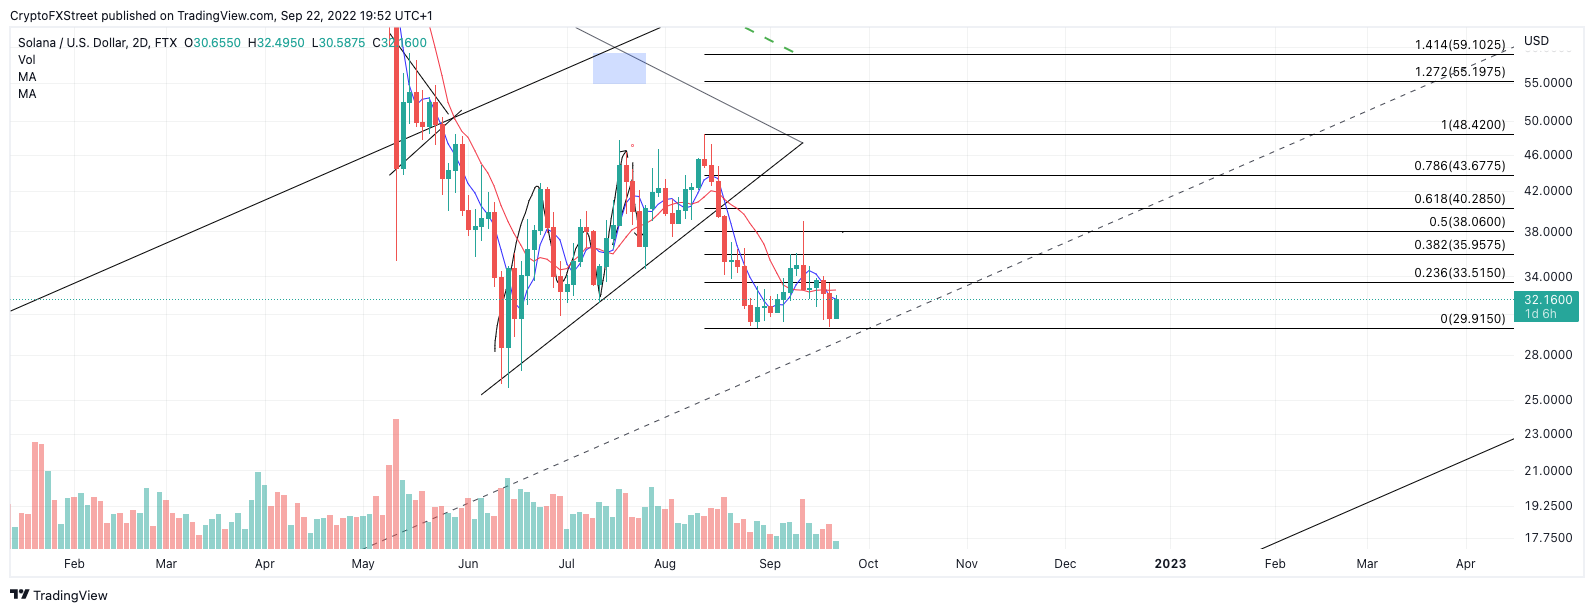
SOL USDT 2-Day Chart
A daily close above $33.14 should give sidelined bulls permission to the 38.2% Fibonacci retracement level (based on the previous swing high to swing low) marked at $35.95.=
Invalidation of the bullish idea is contingent upon the June 14 swing low at $25.75 holding up. If the bears were to breach this level, a further decline targeting a previous congestion zone near $20 could result in a 27% decrease from the current Solana price.
In the following video, our analysts deep dive into the price action of Solana, analyzing key levels of interest in the market.