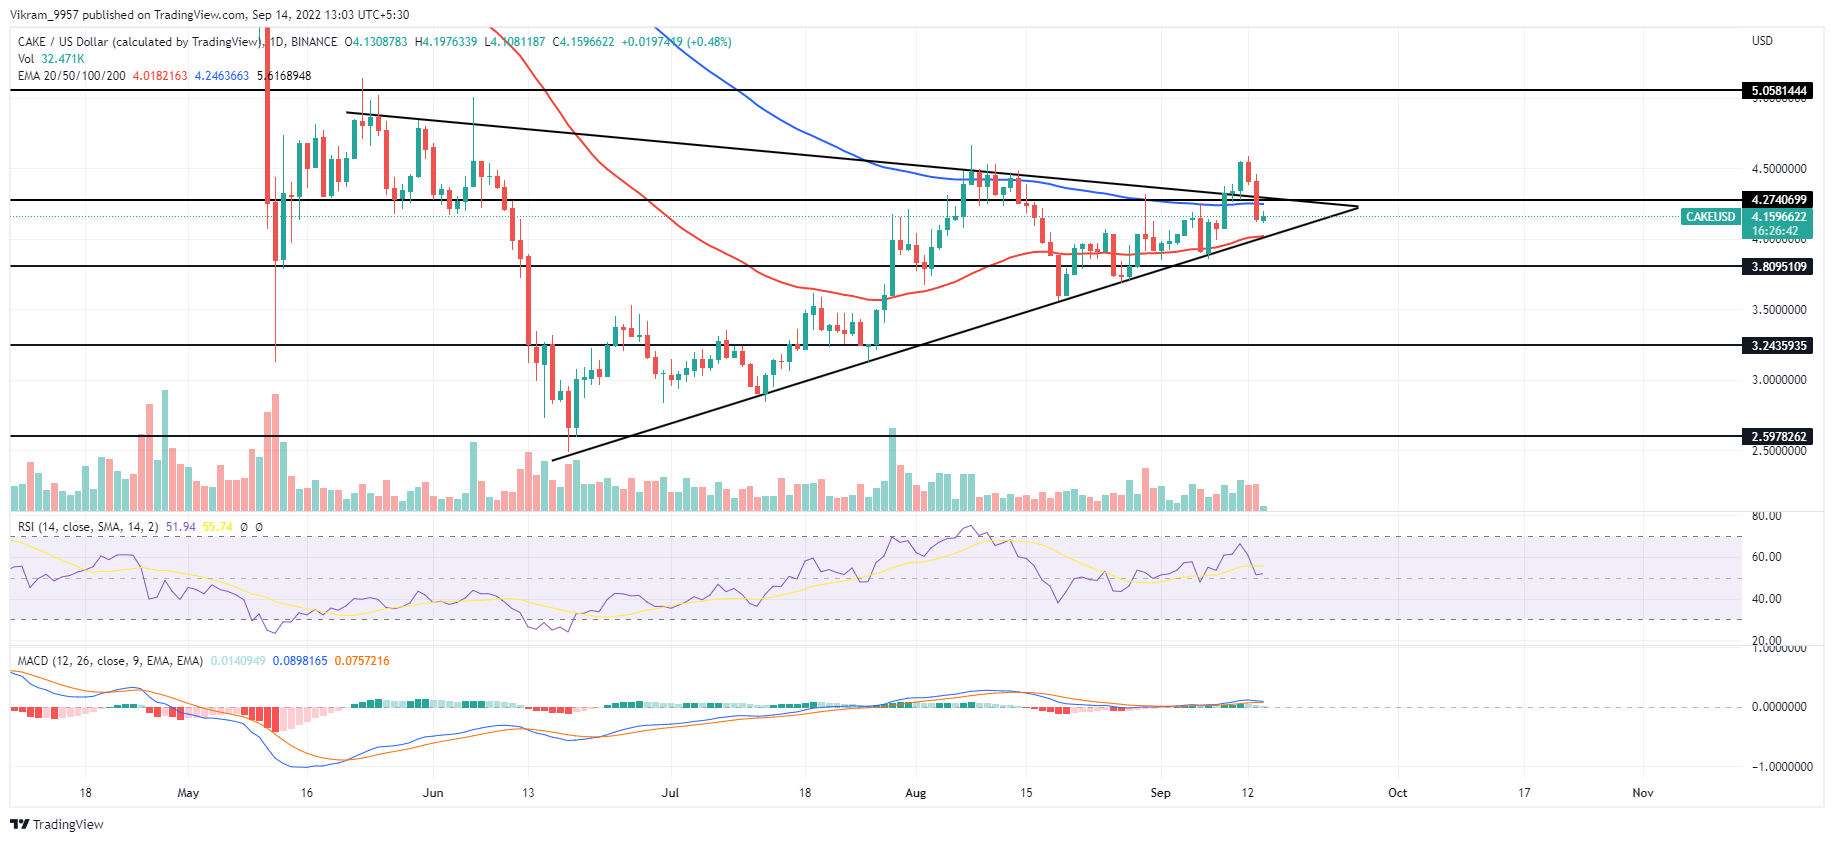
The CAKE price chart shows a failed bullish breakout rally reverting to retest the 50-day EMA, threatening a bearish breakout. The bullish reversal from the support trendline in the triangle pattern rises above the 100-day EMA to give a bullish breakout. However, the unleashed momentum bullish momentum failed to keep the CAKE prices above the resistance trendline. So, will the falling prices crack under the 50-day EMA and the support trendline?
Key Points:
- The PancakeSwap price action shows a failed bullish breakout of a symmetrical triangle pattern.
- The falling prices approach the 50-day EMA teasing a prolonged correction.
- The intraday trading volume in PancakeSwap is $583 million.
 Source - TradingView
CAKE Technical Analysis
The CAKE prices show a bull run of 30% after reverting from the support trendline resulting in the 100-day EMA breakout. Moreover, the price action breaks above the symmetrical triangle pattern and the $4.25 mark. However, the bull run fails to sustain above the 100-day EMA due to the recently declining market conditions with the release of CPI data. As a result, the downtrend breaks below the resistance trendline and approaches the confluence of a 50-day EMA and a support trendline. The daily candle shows higher price rejection after the bearish engulfing candle of 6.13%, reflecting a solid selling spree. If the CAKE prices drop below the 50-day EMA, a downtrend to the next support level of $3.80 seems inevitable. Furthermore, an increase in selling pressure near the support level might result in a bearish breakout, prolonging a correction of 15% to the $3.25 mark. Conversely, a bullish reversal from this support trendline might push the market value back above the $4.25 resistance level and restart the prevailing uptrend.
Technical Indicators
The RSI slowly drops from the overbought boundary to the halfway line within a matter of 48 hours, reflecting a phenomenal increase in selling pressure. Additionally, as the bullish histograms decline, the MACD indicator shows a bearish crossover between the fast and slow lines. Therefore, the technical indicators reflect an increase in selling pressure forecasting a downtrend below the support trendline. Resistance Levels - $4.25 and $4.5 Support Levels - $3.80 and $3.25
 cryptoknowmics.com