OKB prices struggle to rise above the 50% Fibonacci level and the 50-day SMA despite a 22% jump teasing a bearish turnaround. The OKB prices jump by 22% to create a bullish engulfing candle reaching the 50% Fibonacci level near the 200-day SMA. However, the selling pressure above the Fibonacci level and the opposing 50-day SMA warns of a bearish reversal. So, should you expect a bullish trend above the 50% Fibonacci level to reach $20, or a bearish reversal will drop the prices to $15?
Key Points:
- The OKB price action shows a power struggle at the 50% Fibonacci level.
- The opposing 50-day SMA knocks the price back under the 50% Fibonacci level.
- The intraday trading volume in OKB is $61.73 million.
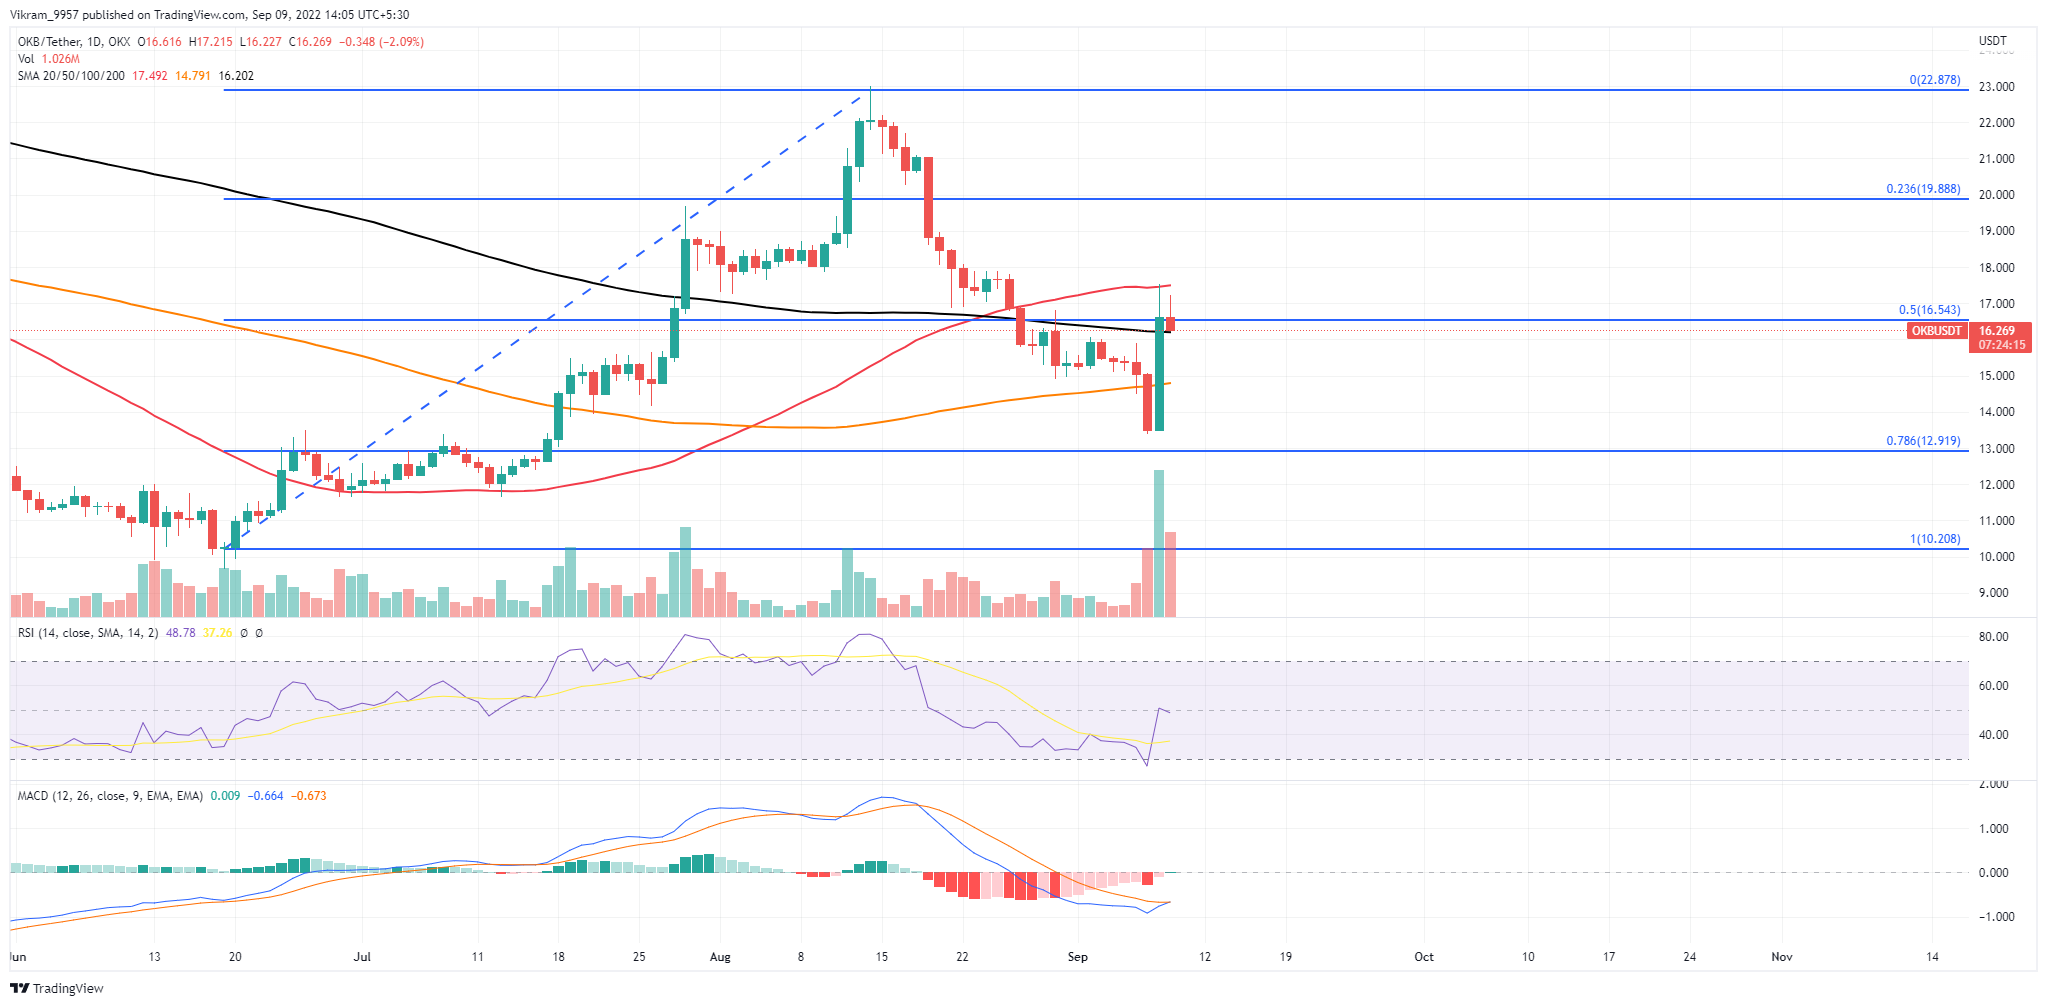 OKB/USD Price Chart"> Source - TradingView
OKB Technical Analysis
The OKB prices took a bearish turnaround from the $22 resistance level with an evening star pattern resulting in a price drop of 40% within 20 days to reach the $13.5 mark. However, the recent bullish engulfing candle with a 22% price jump comes to a 50% Fibonacci level at the $16.5 mark. Furthermore, the increase in intraday trading volumes supports the bullish reversal as it exceeds the 200-day EMA. However, the higher price rejection from the 50-day EMA put the prices back under the 50% Fibonacci level displaying a power struggle at the 200-day EMA. Hence the opposition from the 50-day EMA might push the market value back to the psychological mark of $15. However, if the buyers undermine the higher price rejection, an uptrend continuation will hit the psychological mark of $20.
Technical Indicators
The daily-RSI slope spikes to the halfway line from the oversold zone reflect a phenomenal increase in the underlying buying pressure. The fast and slow lines give a bullish crossover restarting the bullish histograms trend, teasing a potential uptrend continuation in the OKB prices. Hence the technical indicators maintain a buy signal despite a higher price rejection in the daily candle. Resistance Levels - $18 and $20 Support Levels - $15 and $13