Bitcoin has seen a strong monthly recovery period in which the cryptocurrency managed to surge by almost 26% as it returns to $25,000. It seems that Bitcoin is attempting to recover some of the losses since bottoming out at around $17,600 in June.
With the number one ranked cryptocurrency back on the mend, the altcoin sector is seeing some impressive gains.
Today, we will look at Cardano (ADA), XRP (XRP), Solana (SOL), Avalanche (AVAX), and Quant (QNT). We will highlight some support and resistance areas and see where the market can go next week.
Cardano price analysis
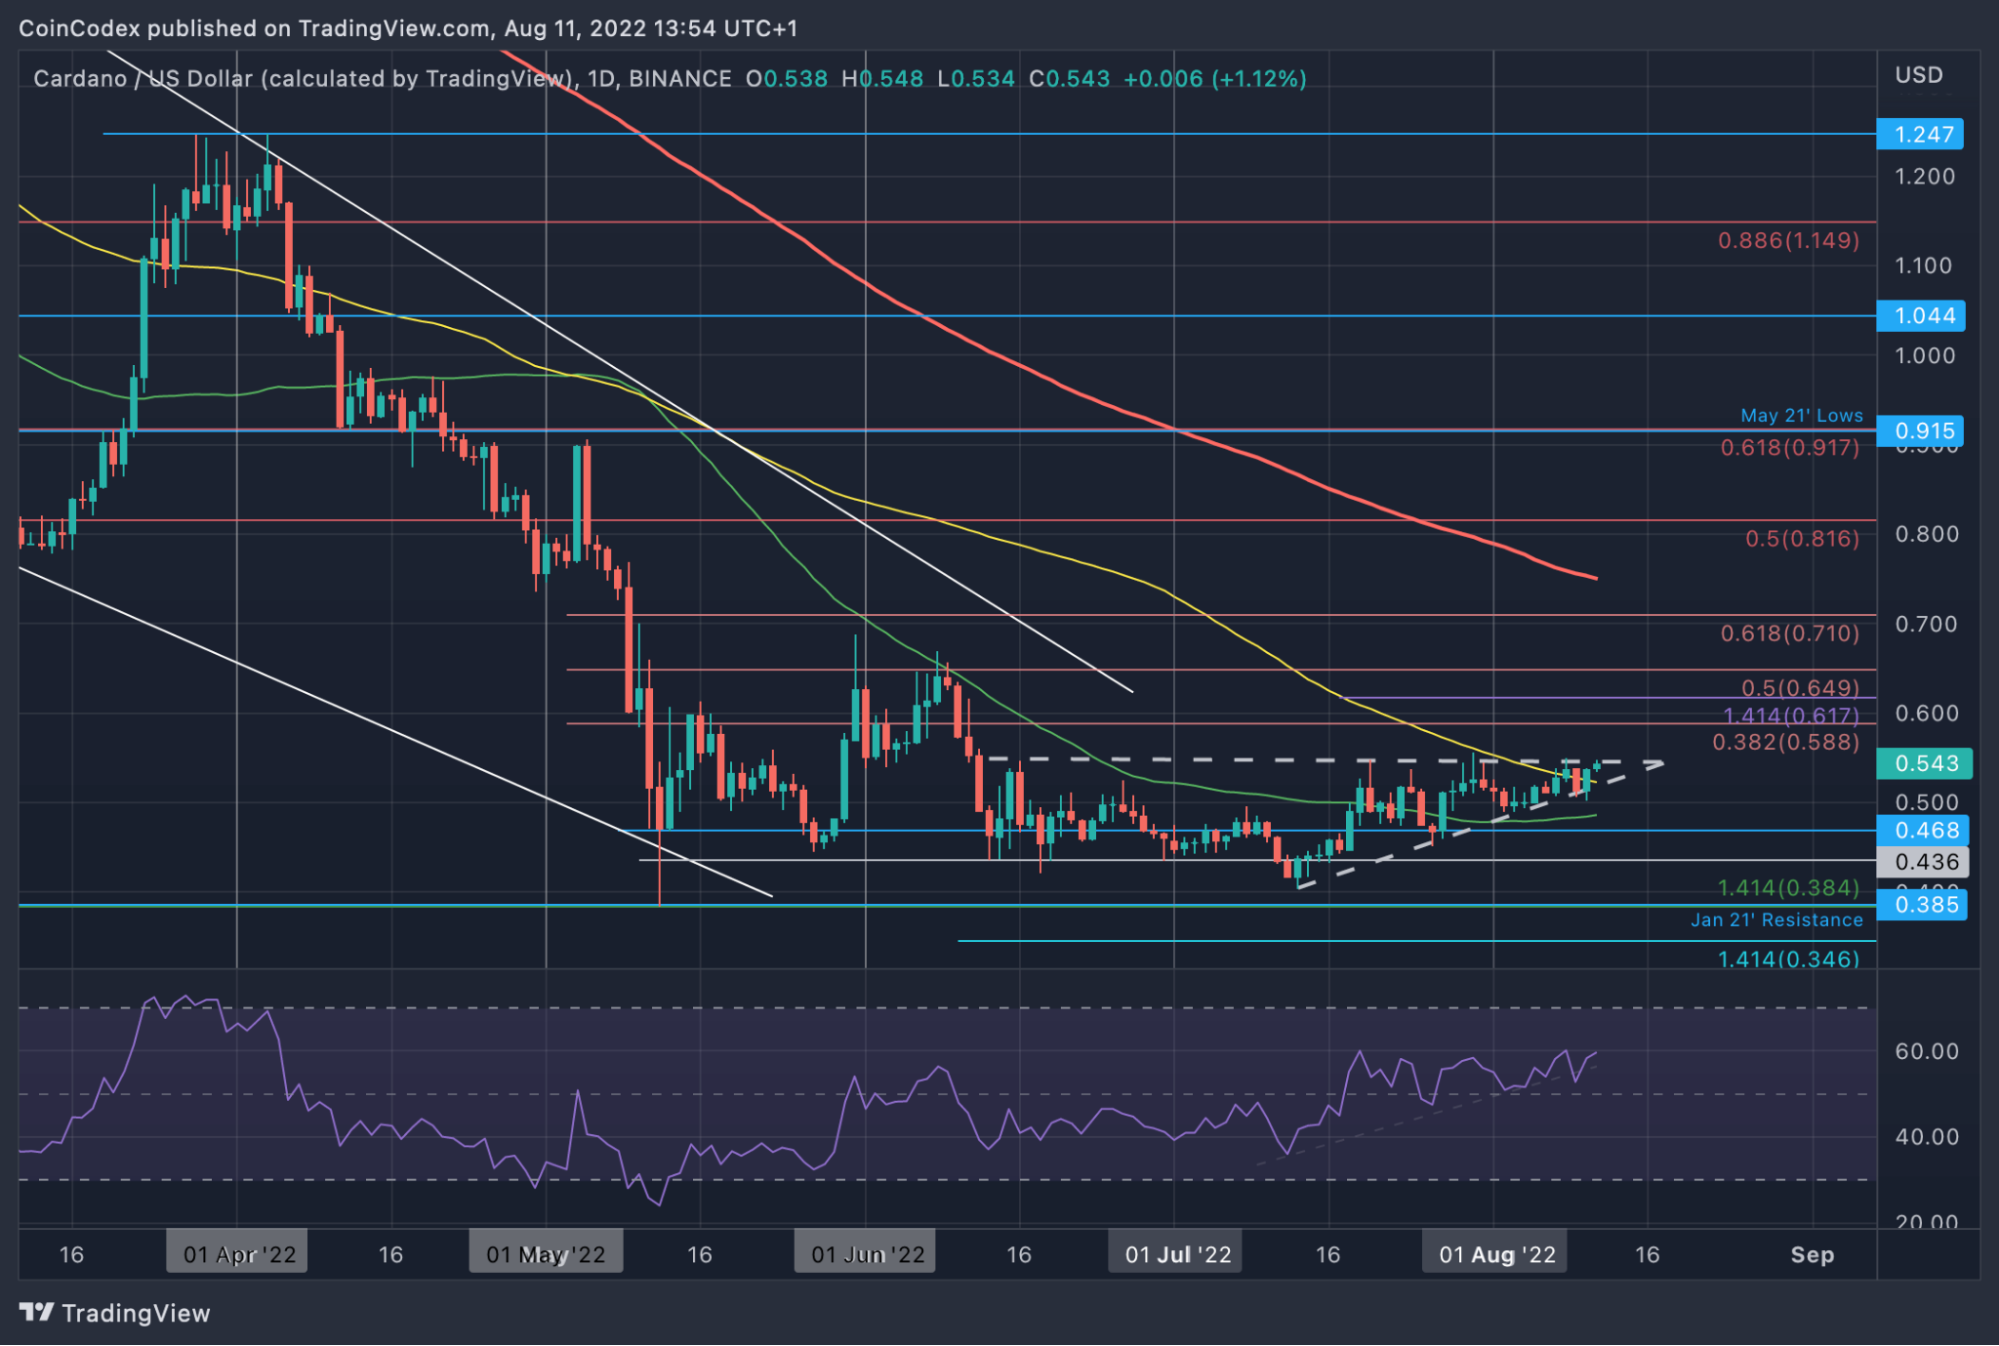
ADA/USD is up by a strong 25% over the past month of trading as the coin trades above $0.5. The cryptocurrency found a low at $0.385 in May and has since traded sideways between there and resistance at $0.65.
In the previous two months, ADA has been trapped inside an ascending triangle pattern, with the roof of the triangle around $0.55. A breakout of this triangle would signal a huge move higher for ADA, where it should be able to make a run above the June resistance at $0.65.
The RSI for ADA is now comfortably above the midline, indicating that the bullish momentum is starting to build, and the bears have left the market. Keep up-to-date with all the latest Cardano price predictions on CoinCodex.
Short-term trend: Bullish above $0.55.
If ADA can break above $0.55, the market will turn bullish in the short term. For a more sustained bull run, ADA must break the June resistance at $0.65.
If the buyers break the current triangle, the first level of resistance lies at $0.588 (bearish .382 Fib Retracement). This is followed by resistance at $0.618 (1.414 Fib Extension), $0.65 (bearish .5 Fib Retracement), and $0.71 (bearish .618 Fib Retracement).
On the other side, the first level of support lies at around $0.522 (100-day MA & lower angle of the triangle). Beneath the triangle, support lies at $0.5, $0.485 (50-day MA), $0.468, and $0.436 (June support).
Ripple price analysis
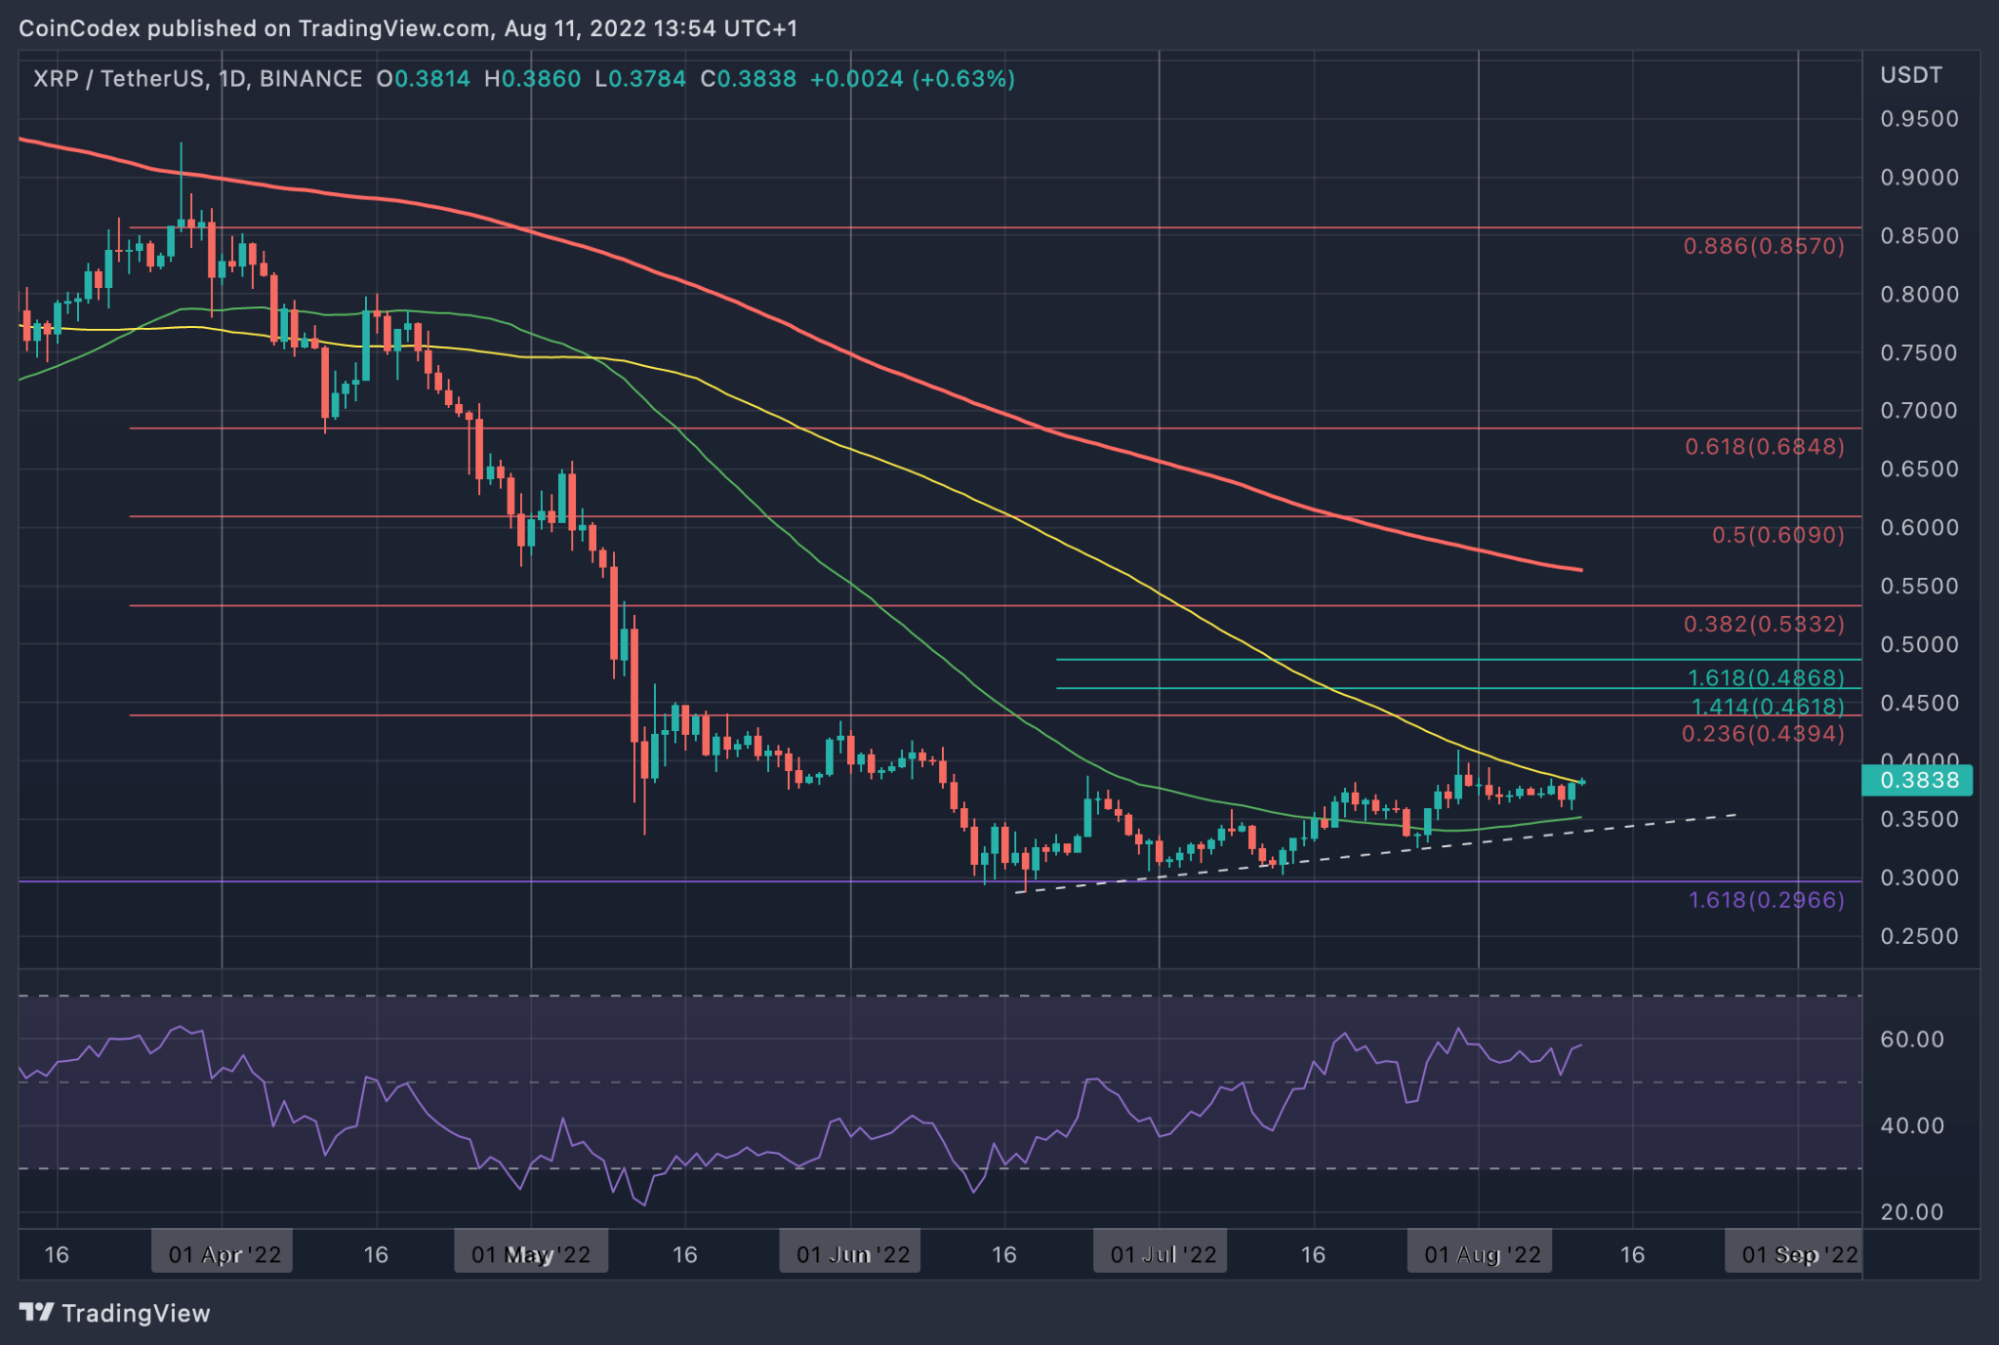
XRP/USD is up by a smaller 22.8% over the past month of trading as the cryptocurrency currently battles with the 200-day MA at around $0.38. XRP has slowly been grinding higher since seeing the bottom at around $0.295 in June 2022.
The move higher has been a slow rebound, with the market facing strong resistance at $0.4 toward the end of July. Nevertheless, a break above $0.4 should set XRP off on a strong recovery rebound and set a more positive outlook for the XRP price prediction.
Short-term trend: Bullish above $0.4
If XRP manages to break $0.4, it could set the stage for a potential run above $0.55. On the other side, a break beneath $0.35 will likely send XRP back into a bearish spiral.
The first resistance above $0.4 lies at $0.44 (bearish .236 Fib Retracement). This is followed by resistance at $0.461 (1.414 Fib Extension), $0.48 (1.618 Fib Extension), $0.5, and $0.522 (bearish .382 Fib Retracement).
On the other side, the first support lies at $0.35 (50-day MA). This is followed by $0.325, $0.3, and $0.285.
Solana price analysis
SOL/USD is up by an impressive 32% over the past month of trading as the coin climbs above the 100-day MA level today. The cryptocurrency saw the local low in June, where support was found at $25.75.
Since then, SOL has been trading inside an ascending triangle pattern, with the roof of the triangle at $46 - provided by a bearish .236 Fib Retracement level. The market has attempted to break this resistance twice in July but was rejected on each attempt.
A break above the roof of the triangle should allow SOL to make a run back toward the 200-day MA at around $70. You can find the latest Solana price predictions on CoinCodex.

Short-term trend: Bullish above $46
A break of $46 would turn SOL bullish in the short term. It would need to break $58 for a more sustained bullish push higher.
Beyond $46, the first level of resistance lies at $50. This is followed by resistance at $58.40 (May 2021 highs), $60, $68.50 (bearish .5 Fib Retracement), and $70 (200-day MA).
On the other side, the first level of support lies at $40 - provided by the lower angle of the triangle. Beneath the triangle, support lies at $37.56 (Jul 2021 resistance), $32.50 (August 2021 lows), and $30.
Avalanche price analysis
AVAX/USD is up by an impressive 68% over the past month of trading as the cryptocurrency currently battles with resistance at $30. AVAX met the local low in June 2022 at $14 and has been climbing higher inside an ascending price channel ever since.
A break above the upper angle of the price channel should set AVAX off on an exponential price surge toward the $50 level.
Interestingly, the RSI for AVAX is now in overbought conditions, indicating the buyers are completely dominating the market momentum. Will this have a negative impact on the Avalanche price prediction?
Short-term trend: Bullish
AVAX is considered bullish after surging more than 60% over the past month. To turn bearish again, the cryptocurrency would need to fall beneath $25 (lower angle of the price channel & 200-day MA).
Above $30, the first resistance lies at $32 (upper angle of the price channel). This is followed by resistance at $35 (bearish .236 Fib Retracement), $38.12 (1.414 Fib Extension), $40, $41.65, and $48.25.
On the other side, support lies at $28, $26, $24, and $20.
Quant Price Analysis
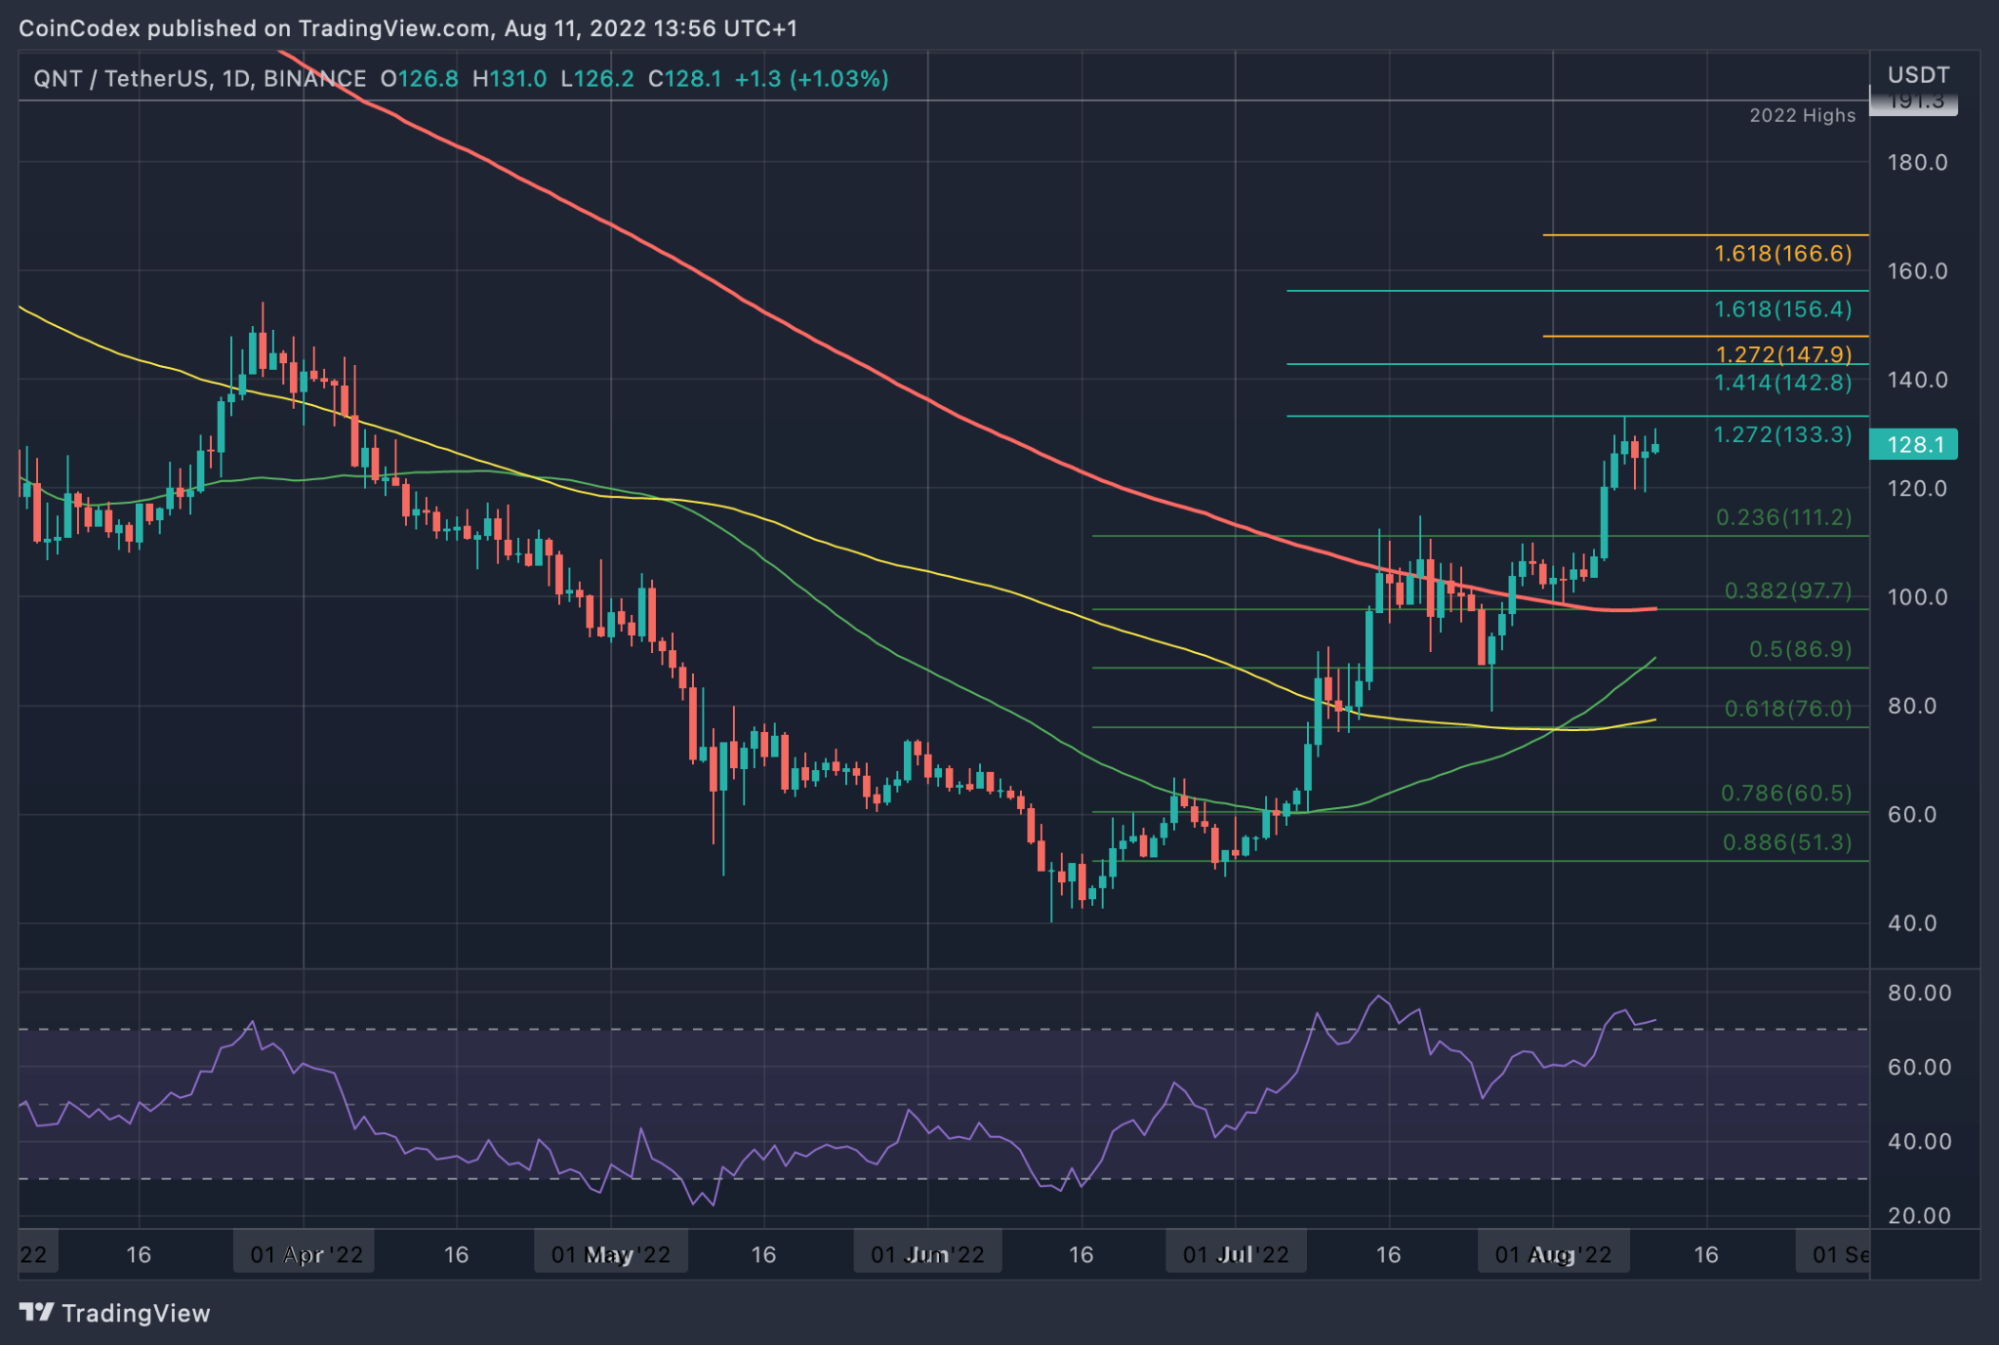
QNT/USD also saw an impressive 57% price surge over the past month of trading. Furthermore, it is up by 90% over the past 3-months as it currently sits at $128.
QNT saw the local bottom at $40 in June and has since been on an incredible run higher. In July, it hit resistance at $111, but this level was taken out earlier in the week as QNT surged to $133.
Keep up-to-date with all the latest QNT predictions.
Short-term trend: Bullish
QNT is certainly considered bullish right now. It would need to drop back beneath $100 (100-day MA) for the Quant price prediction to turn bearish.
The first level of resistance lies at $133 (1.272 Fib Extension). This is followed by resistance at $143 (1.414 Fib Extension), $150, $156 (1.618 Fib Extension), and $166.
On the other side, the first support lies at $120. This is followed by $111 (.236 Fib), $100 (.382 Fib & 100-day MA), $87, $80, and $76 (200-day MA).