
United States Dollar Coin ($USDC) took a backseat in real volume (TRV) during February as Binance United States Dollar ($BUSD) saw a 51% increase in real volume over $USDC.
February proved to be a difficult month for $USDC, bringing in approximately $49 billion in real volume, according to Be[In]Research. While the figure is relatively large, compared to other stablecoins, the TRV for $USDC and $BUSD was down $1.2 trillion – a staggering 90% decrease in TRV compared to January 2021’s figures.
$USDC still on the rise
The decrease in real volume over the last month would have had little effect on the demand for stablecoins. Since February of last year, $USDC’s TRV was up 23%, sitting at approximately $39.7 billion.

Source: Messari
$USDC’s single-day high plummeted by $611 billion
In addition to $USDC’s increasing TRV, its single-day high was still 11% higher than its highest day in February.
As of last month, the single-day high rested at $3.7 billion in TRV, compared to $3.3 billion in February 2021.
$BUSD outpaces $USDC
While $USDC managed $49 billion in February volume, Binance USD ($BUSD) managed to record approximately $74 billion.
In contrasting fortunes to $USDC, the TRV decreased by 89% from January 2022, with $BUSD sitting at $682 billion. Its TRV also saw a year-on-year monthly decrease for February, compared to February’s $99 billion last year – a 25% decrease.
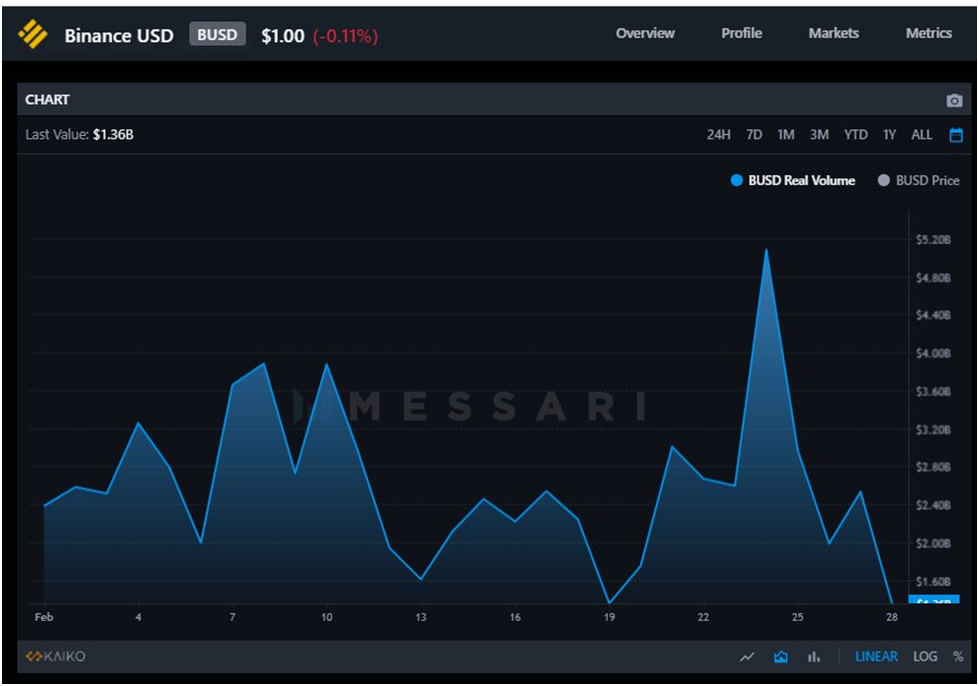
Source: Messari
Do traders prefer $BUSD?
Tether ($USDT) remains the top stablecoin by market capitalization, holding the title as the second-largest stablecoin by market cap as of press time. However, as of February, $BUSD seems to be the clear favorite after $USDT – at least by TRV metrics.
In January, $USDC experienced a 0.91% increase over $BUSD, having 51% more real volume than $USDC.
But why?
Transaction counts and average transactional volume can be credited as the key attributes for the contrasting fortunes in real volumes, according to Be[In]Crypto Research. Based on calculations, the total transaction count for $USDC for February 2022 was more than 1.1 million, while $BUSD had over 22,000 transactions.
If the transaction count for $USDC is more than $BUSD, then why is $BUSD’s real volume 51% greater than $USDC?
Although $USDC recorded 4,900% more in total transaction counts in February than $BUSD, their average transaction value was relatively lower.
Looking back to February 24, both stablecoins recorded single-day high transaction counts, which coincided with Russia deciding to conduct an unprovoked invasion of Ukraine that same day, leading to a plunge in the price of crypto everywhere.
The bearish outlook of the market led to a spike in the demand for stablecoins. By the end of the day, the transaction count for $USDC and $BUSD was 74,568 and 1,388, respectively. Evidently, this yielded an average transactional value of $150,000 on the day for $USDC, as illustrated below.
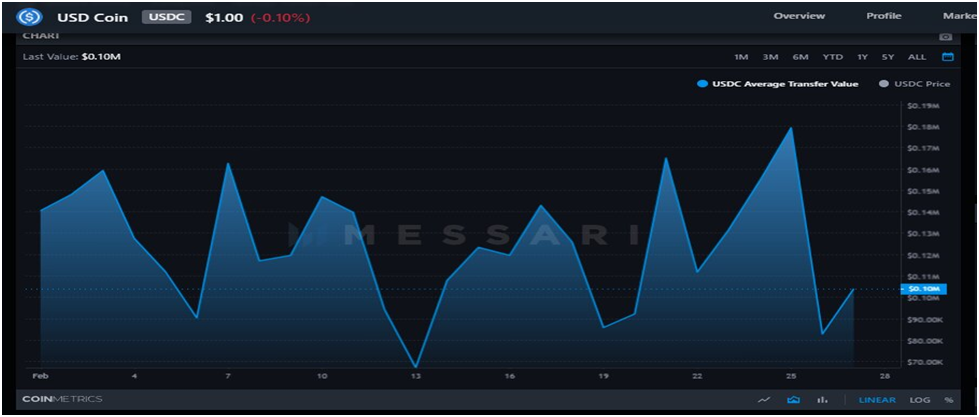
Source: Messari
On the other hand, the average transaction counts of $1.01 million for $BUSD on the day.
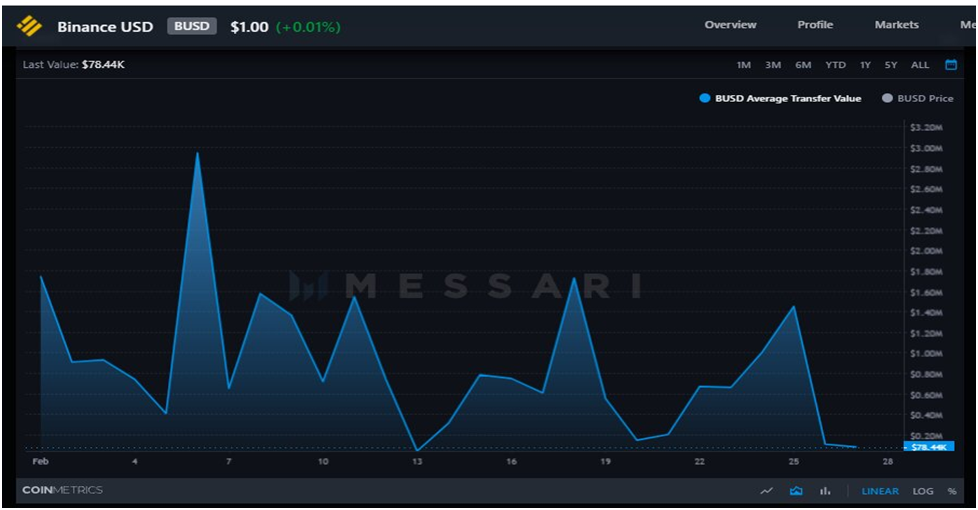
Source: Messari
Since real volume constitutes the accumulation of daily transaction volumes, which brings about average transactional counts, this would explain why there was a decrease in real volume of $USDC (although it had more transactional counts).
As uncertainty surrounding the ongoing events in the Russia-Ukraine conflict continues, March should experience more impressive TRV figures.