Blockchain analytics firm Glassnode says that activity on the Ethereum network is surging amid the second-largest crypto asset by market cap breaking staggering all-time highs above $3,500.
In its weekly report, Glassnode reveals that ETH holders are actively moving their coins from centralized exchanges and holding them in their own wallets, suggesting that a supply crunch could be driving Ethereum’s massive rallies.
“This week a relatively large volume of ETH was removed from known exchange wallets, spiking to over 200k ETH in a single day. The chart below demonstrates that in 2021, there have been 10 such occurrences with withdrawals of over 200k ETH/day. This compares to only two days with exchange inflows over 200k ETH per day indicating a general preference for self-custody of funds.”
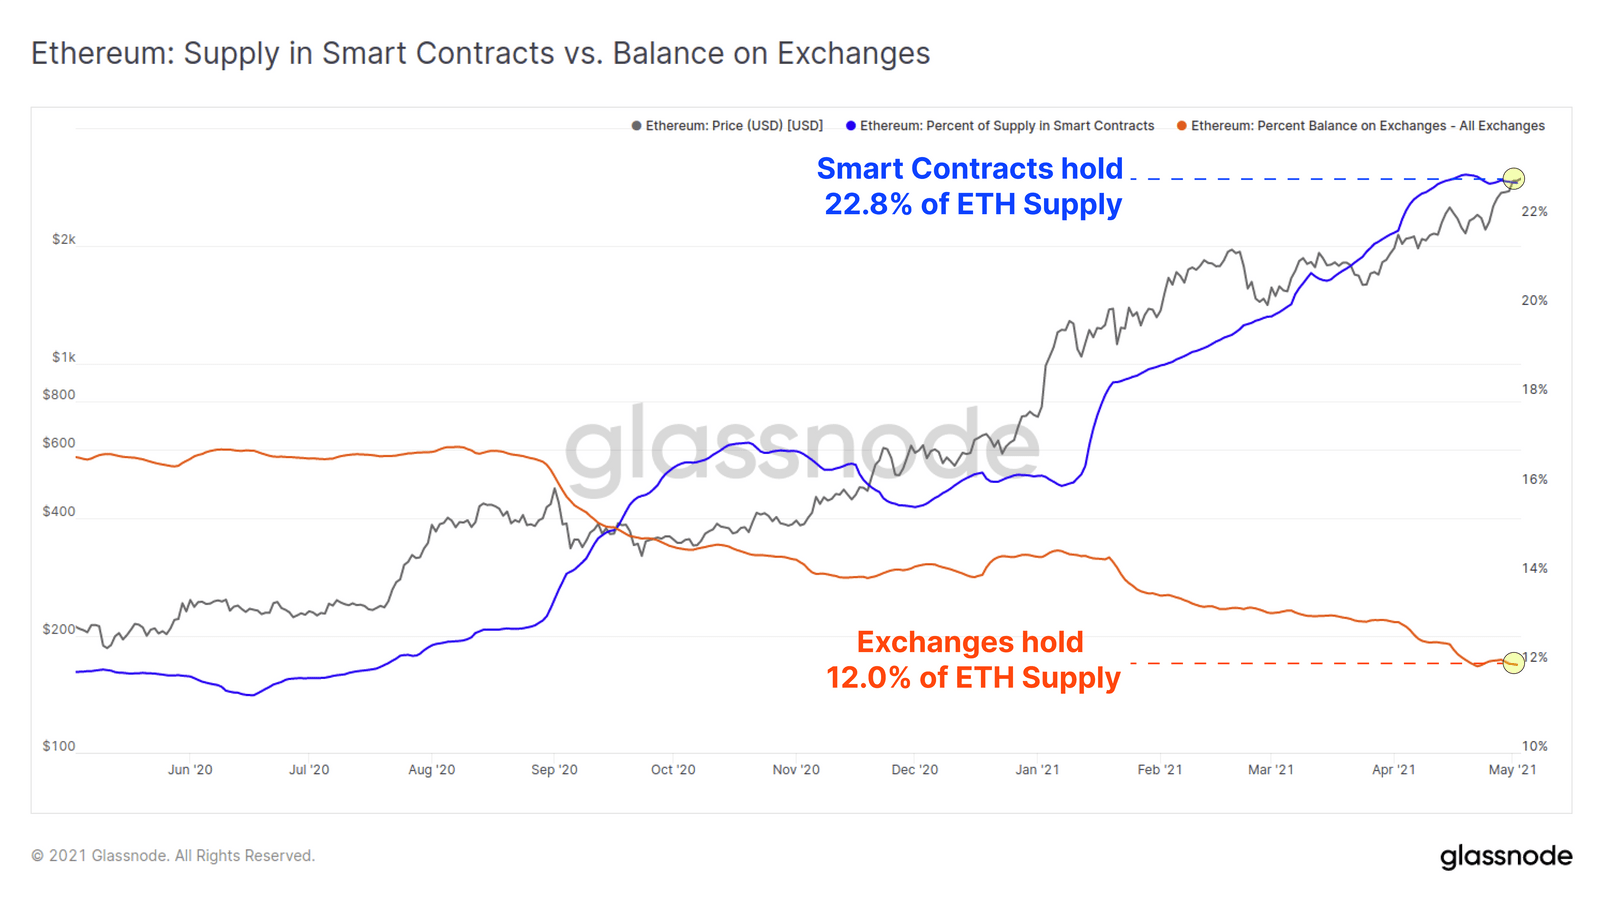
The report says that exchanges now hold only 12% of the total ETH supply, while smart contracts have 22.8%, indicating soaring interest in the decentralized finance (DeFi) space.
“The almost equal and opposite trend for these curves demonstrates a clear product market fit and demand for DeFi by ETH holders.”
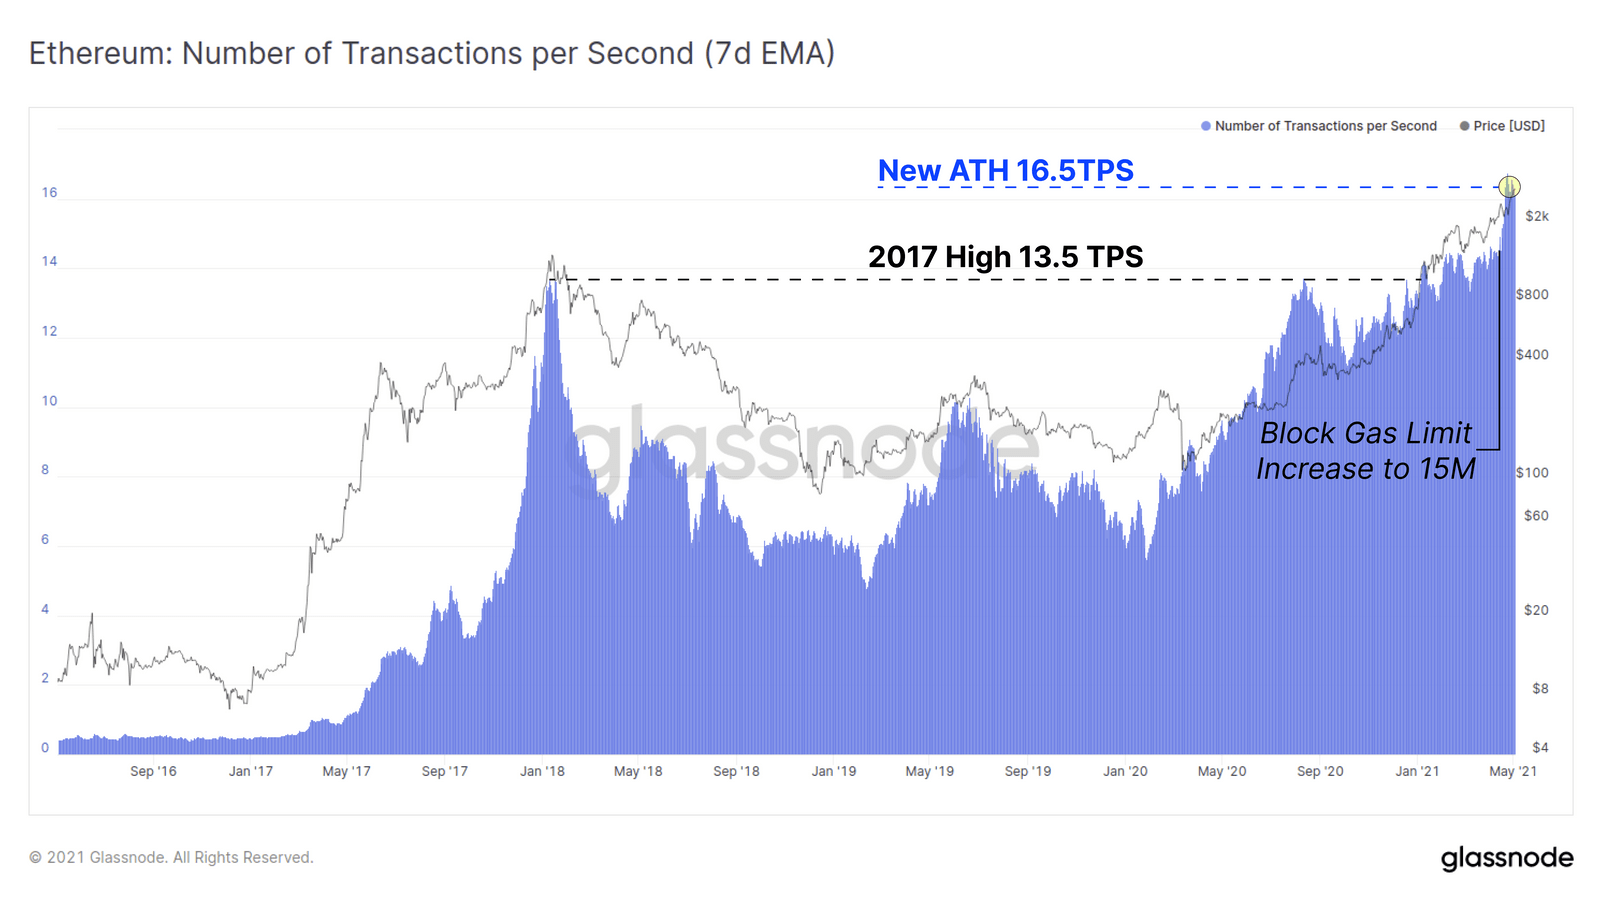
Glassnode says Ethereum is also seeing higher throughput since Ethereum miners adjusted the block gas limit to 15M, leading to a drop in gas prices and therefore an increase in transaction volumes.
“The overall throughput of the Ethereum chain has reached a new all-time-high this week of 16.5 transactions per second. The prior all-time-high of 13.5 TPS was set at the peak of the 2017 bull run which has since been eclipsed for the majority of 2021.”
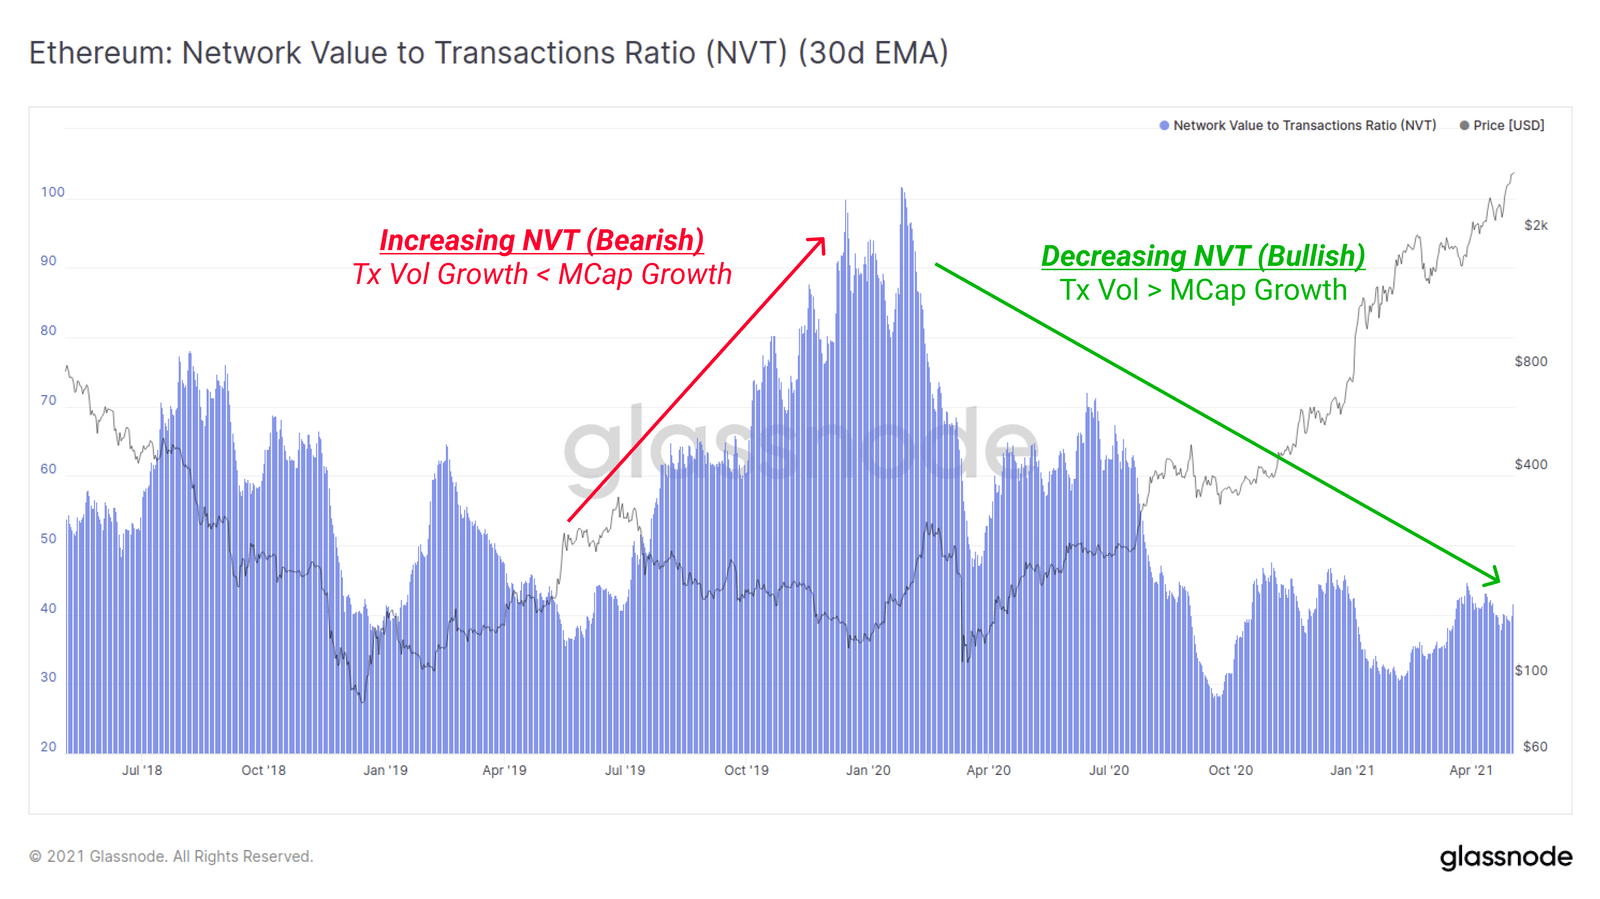
The report adds that the spike in activities is lowering the Ethereum NVT Ratio (Network Value to Transactions Ratio), a measure of the network’s market cap against the volume of US dollar transmitted on-chain. A downward trend is typically viewed as a bullish indicator for the network.
“The chart below demonstrates an Ethereum NVT trending strongly downwards since Jan 2020, especially since the sell-off in March 2020. Recent high transaction throughput has also driven the NVT Ratio lower over the past few weeks, suggesting support for the recent constructive price action.”