Ethereum is up more than 4% and it surged above the $240 resistance against the US Dollar. ETH is currently showing a lot of bullish signs and it is likely to accelerate above $250.
- Ethereum is gaining bullish momentum and it is trading nicely above $240.
- The price traded close to the $250 resistance and settled above the 100 hourly simple moving average.
- There is a bullish flag pattern forming with resistance near $244 on the hourly chart of ETH/USD (data feed via Kraken).
- The pair is likely to accelerate gains if it clears the $248 and $250 resistance levels in the near term.
Ethereum Price Rallies 4%
Yesterday, we discussed the chances of an upside break in Ethereum price above the $240 resistance against the US Dollar. ETH did gain traction above the $240 resistance and settled well above the 100 hourly simple moving average.
It opened the doors for more gains and the price broke the $245 level. Ether traded close to the $250 level and an intraday high is formed near $248. The price is currently correcting lower and trading below the $245 level.
It broke the 23.6% Fib retracement level of the recent rally from the $227 low to $247 high. It seems like there is a bullish flag pattern forming with resistance near $244 on the hourly chart of ETH/USD.
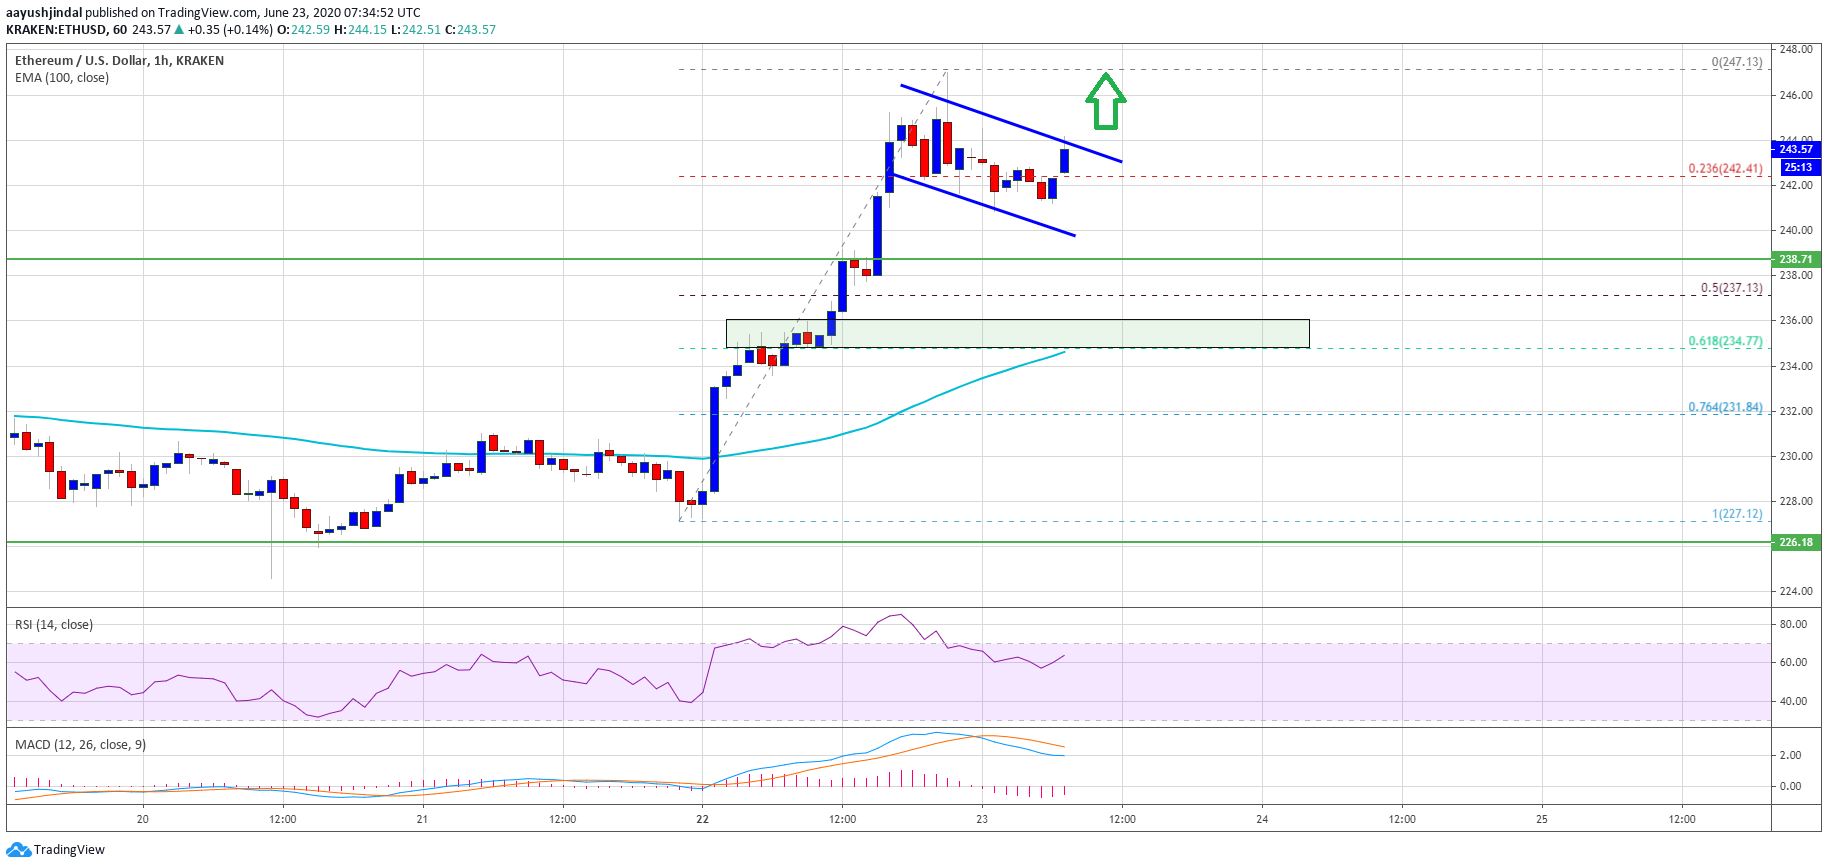
Ethereum price trades above $240. Source: TradingView.com
The first key support is seen near the $240 and $238 levels (the recent breakout zone). The 50% Fib retracement level of the recent rally from the $227 low to $247 high is also near the $238 level.
On the upside, ether price is likely to clear the channel resistance at $244. If the bulls succeed in gaining momentum above $245, there are high chances of more gains above the $248 and $250 resistance levels. The next target for the bulls could be $255 or even $262.
Dips Supported in ETH
The $238 level is likely to act as a major support. If Ethereum fails to stay above $238, it could extend its decline towards the $234 support level and the 100 hourly simple moving average.
Any further losses below the $234 support zone could negate the current bullish view. In the mentioned case, it could decline back towards the $225 support.
Technical Indicators
Hourly MACD – The MACD for ETH/USD is about to move back into the bullish zone.
Hourly RSI – The RSI for ETH/USD is now well above the 55 level, with bullish signs.
Major Support Level – $238
Major Resistance Level – $248
Take advantage of the trading opportunities with Plus500
Risk disclaimer: 76.4% of retail CFD accounts lose money.