The ETH coin price finally manages to rise against the increasing selling pressure with the demand near $3000 and aims to reach $3500.
Ethereum is an open-source, decentralized Blockchain system that has the cryptocurrency it owns, Ether. ETH serves as a platform to support a variety of other cryptos in addition to being used to execute the decentralization of smart contracts.
Ethereum was first introduced in a whitepaper from 2013 written by Vitalik Buterin. Buterin, together with co-founders of the Ethereum project, obtained funding for the project through an online crowd-funding sale during the summer of 2014.
Let us move ahead to read about ETH technical analysis.
Past Performance of ETH
ETH coin price faces a downfall of more than 20% due to the supply dump near $3850. The downfall finds support near $3000 and shows lower price rejection during the bullish reversal. The reversal shows growth of almost 10% in the past 48 hours.
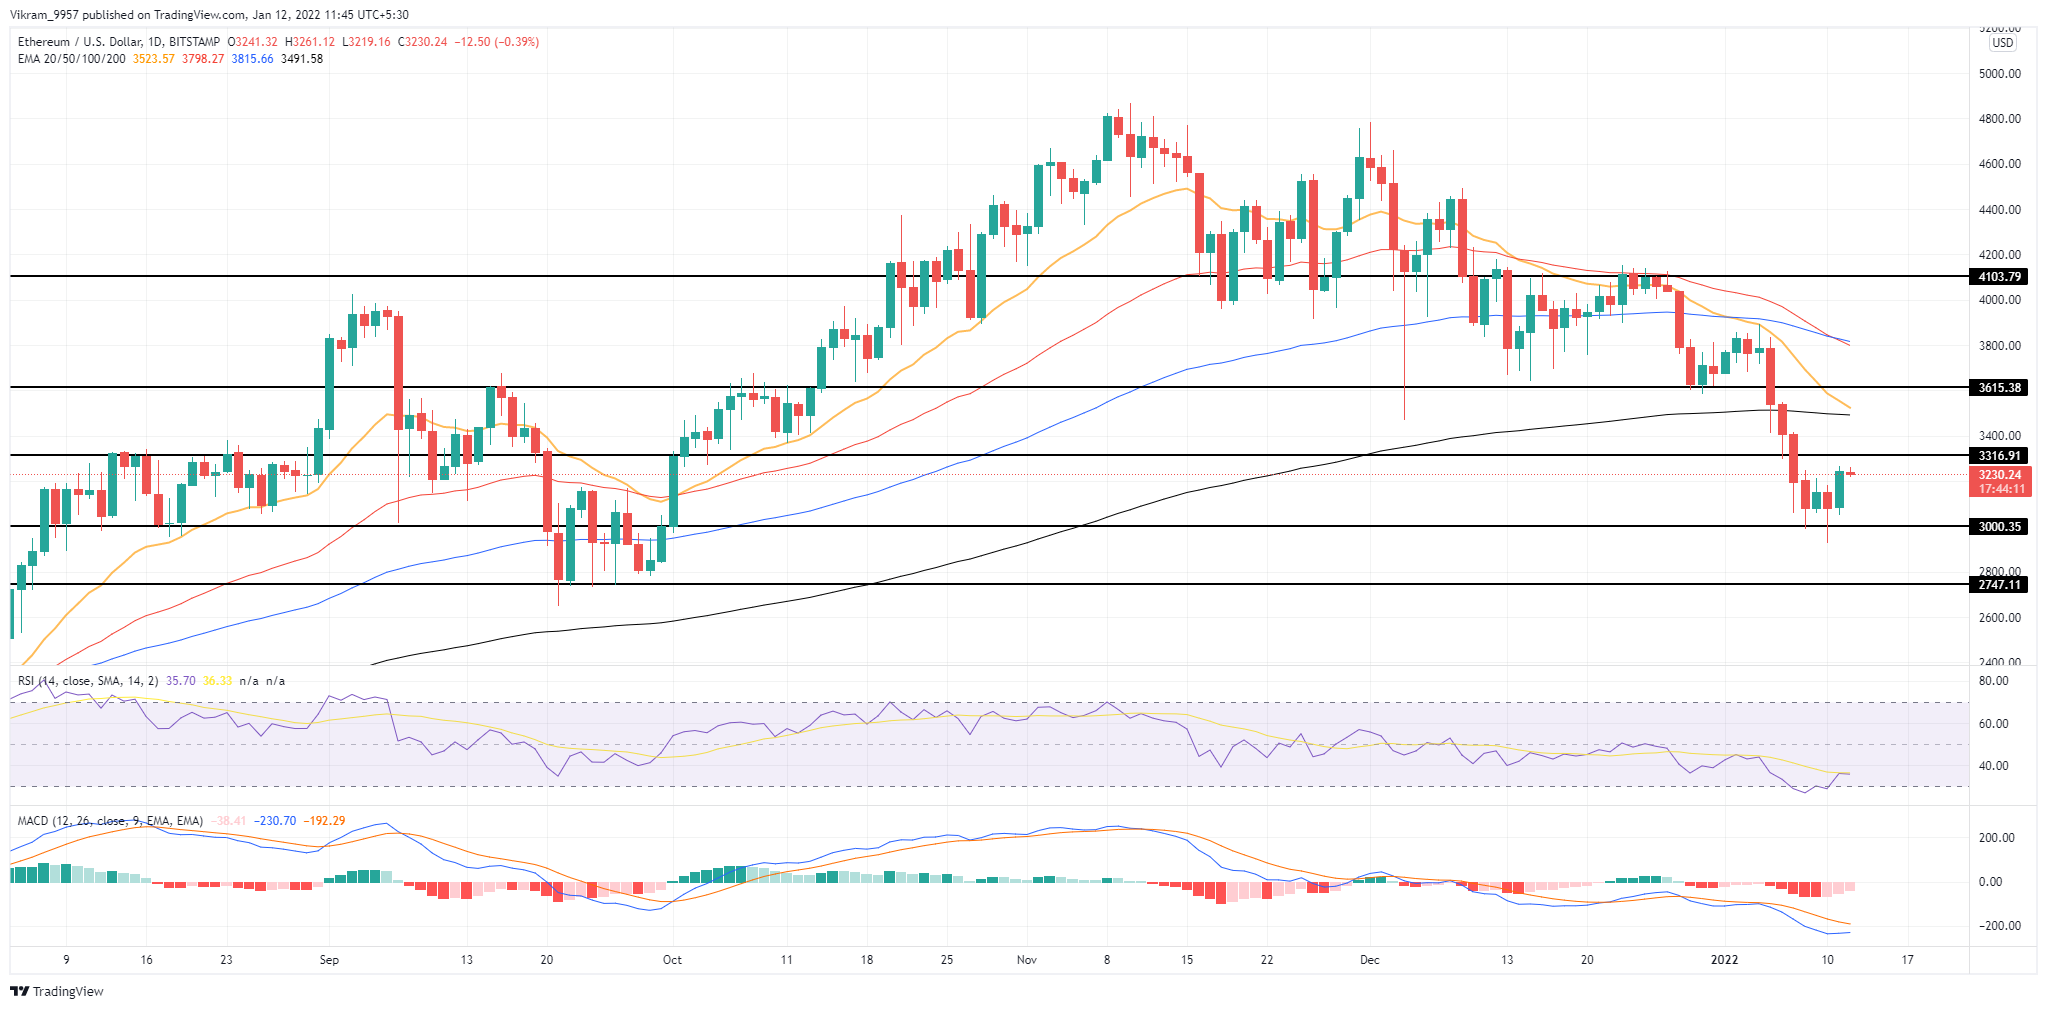
Source - TradingView
ETH Technical Analysis
The ETH coin price shows lower price rejection after the rise from the support zone at $3000. Moreover, the bullish engulfing candle breaks above $3200 and starts a bullish journey that can shortly reach above $3500.
The crucial EMAs (50, 100, and 200) show a bearish alignment as the ETH prices fall below all the daily EMAs. Moreover, the bearish crossover of 50 and 100-days EMA increases the possibility of a death cross.
The RSI indicator at 35% overlaps with the 14-day SMA as it rises higher after the oversold boundary pushes the slope higher. Therefore, a bullish crossover can shortly reflect a revolt from the underlying bullishness.
The MACD indicator shows a gradual reversal in the MACD line as the MACD and signal lines trend deeper below the zero line. Moreover, the weakening intensity of bearish histograms increases the chances of a bullish crossover of fast and slow lines.
Upcoming Trend
The reversal from $3000 shows a rise in ETH coin prices and weakens the selling pressure. Moreover, the breakout of $3200 increases the possibility of a price jump to the 200-day EMA at $3500.
The ETH technical analysis indicates resistance levels at $3300 and $3600 with a psychological mark at $3500. The support levels are at $3000 and $2750 which can halt the downfall.
The increasing coin prices lack bullish commitment evident by the 25% fall in the intraday trading volume. Therefore, traders need to keep an eye near the resistance level at $3300.