Key highlights:
- Ethereum is up by a strong 30% over the past week of trading as it sits above $2,250
- The cryptocurrency surged as high as $2,400 yesterday but failed to overcome resistance at $2,365 (bearish .236 Fib)
- Against Bitcoin itself, Ethereum is trading inside a symmetrical triangle pattern and is testing the lower boundary as it sits beneath ₿0.06
| Ethereum price | $2,260 |
|---|---|
| Key ETH resistance levels | $2,363, $2,535, $2,620 $2,725, $2,800 |
| Key ETH support levels | $2,200, $2,157, $2,072, $2,000, $1,868 |
*Price at the time of publication
Ethereum is up by an impressive 30% over the past week of trading as the cryptocurrency breaks consolidation to reach above $2,400. Unfortunately, the cryptocurrency was unable to break resistance at $2,365, provided by a bearish .236 Fib Retracement, and has since dropped lower from there.
Ethereum had broken above a descending wedge pattern on the daily chart last week and started to surge higher from there. By Friday, ETH had managed to break the 20-day MA and the 50-day MA for the first time since the mid-May market capitulation.
Since breaking the 50-day MA, ETH continues to edge higher and spiked as high as the 100-day MA yesterday.
The price surge is primarily driven by the fact that BTC managed to surge back above $38K over the past week. However, there are still some strong fundamental driving forces for ETH in play.
For example, the highly anticipated London hard fork is just 8-days away, scheduled for August 4th. This upgrade will see the introduction of EIP-1559, which will make ETH a deflationary currency as some transaction fees are burnt.
In the run-up toward the hard fork, it seems that whales are continuing to accumulate. According to data from Santiment, the top-10 non-exchange ETH whales have added 21.3 million ETH to their holdings over the past week, hitting a new 5-year high:
? #Ethereum's top 10 non-exchange whales are adding on to their holdings, as their 21.3M $ETH held this week established a new 5-year high. Meanwhile, top 10 exchange whales recently hit a low of 4.66M $ETH, the lowest since ETH's 2015 inauguration. https://t.co/EbZkHLvM7A pic.twitter.com/ahYenJcegW
— Santiment (@santimentfeed) July 25, 2021
In other news, there are now well over 200,000 validators on the ETH2 staking network. There are now a total of 6.4 million ETH in the ETH2 deposit contract, which is worth well over $14 billion.
The recent price surge allowed the ETH market cap to hit $267 billion.
Let us continue to take a look at the markets and see where they might be heading.
Ethereum price analysis
Daily chart
4-hour chart
What has been going on?
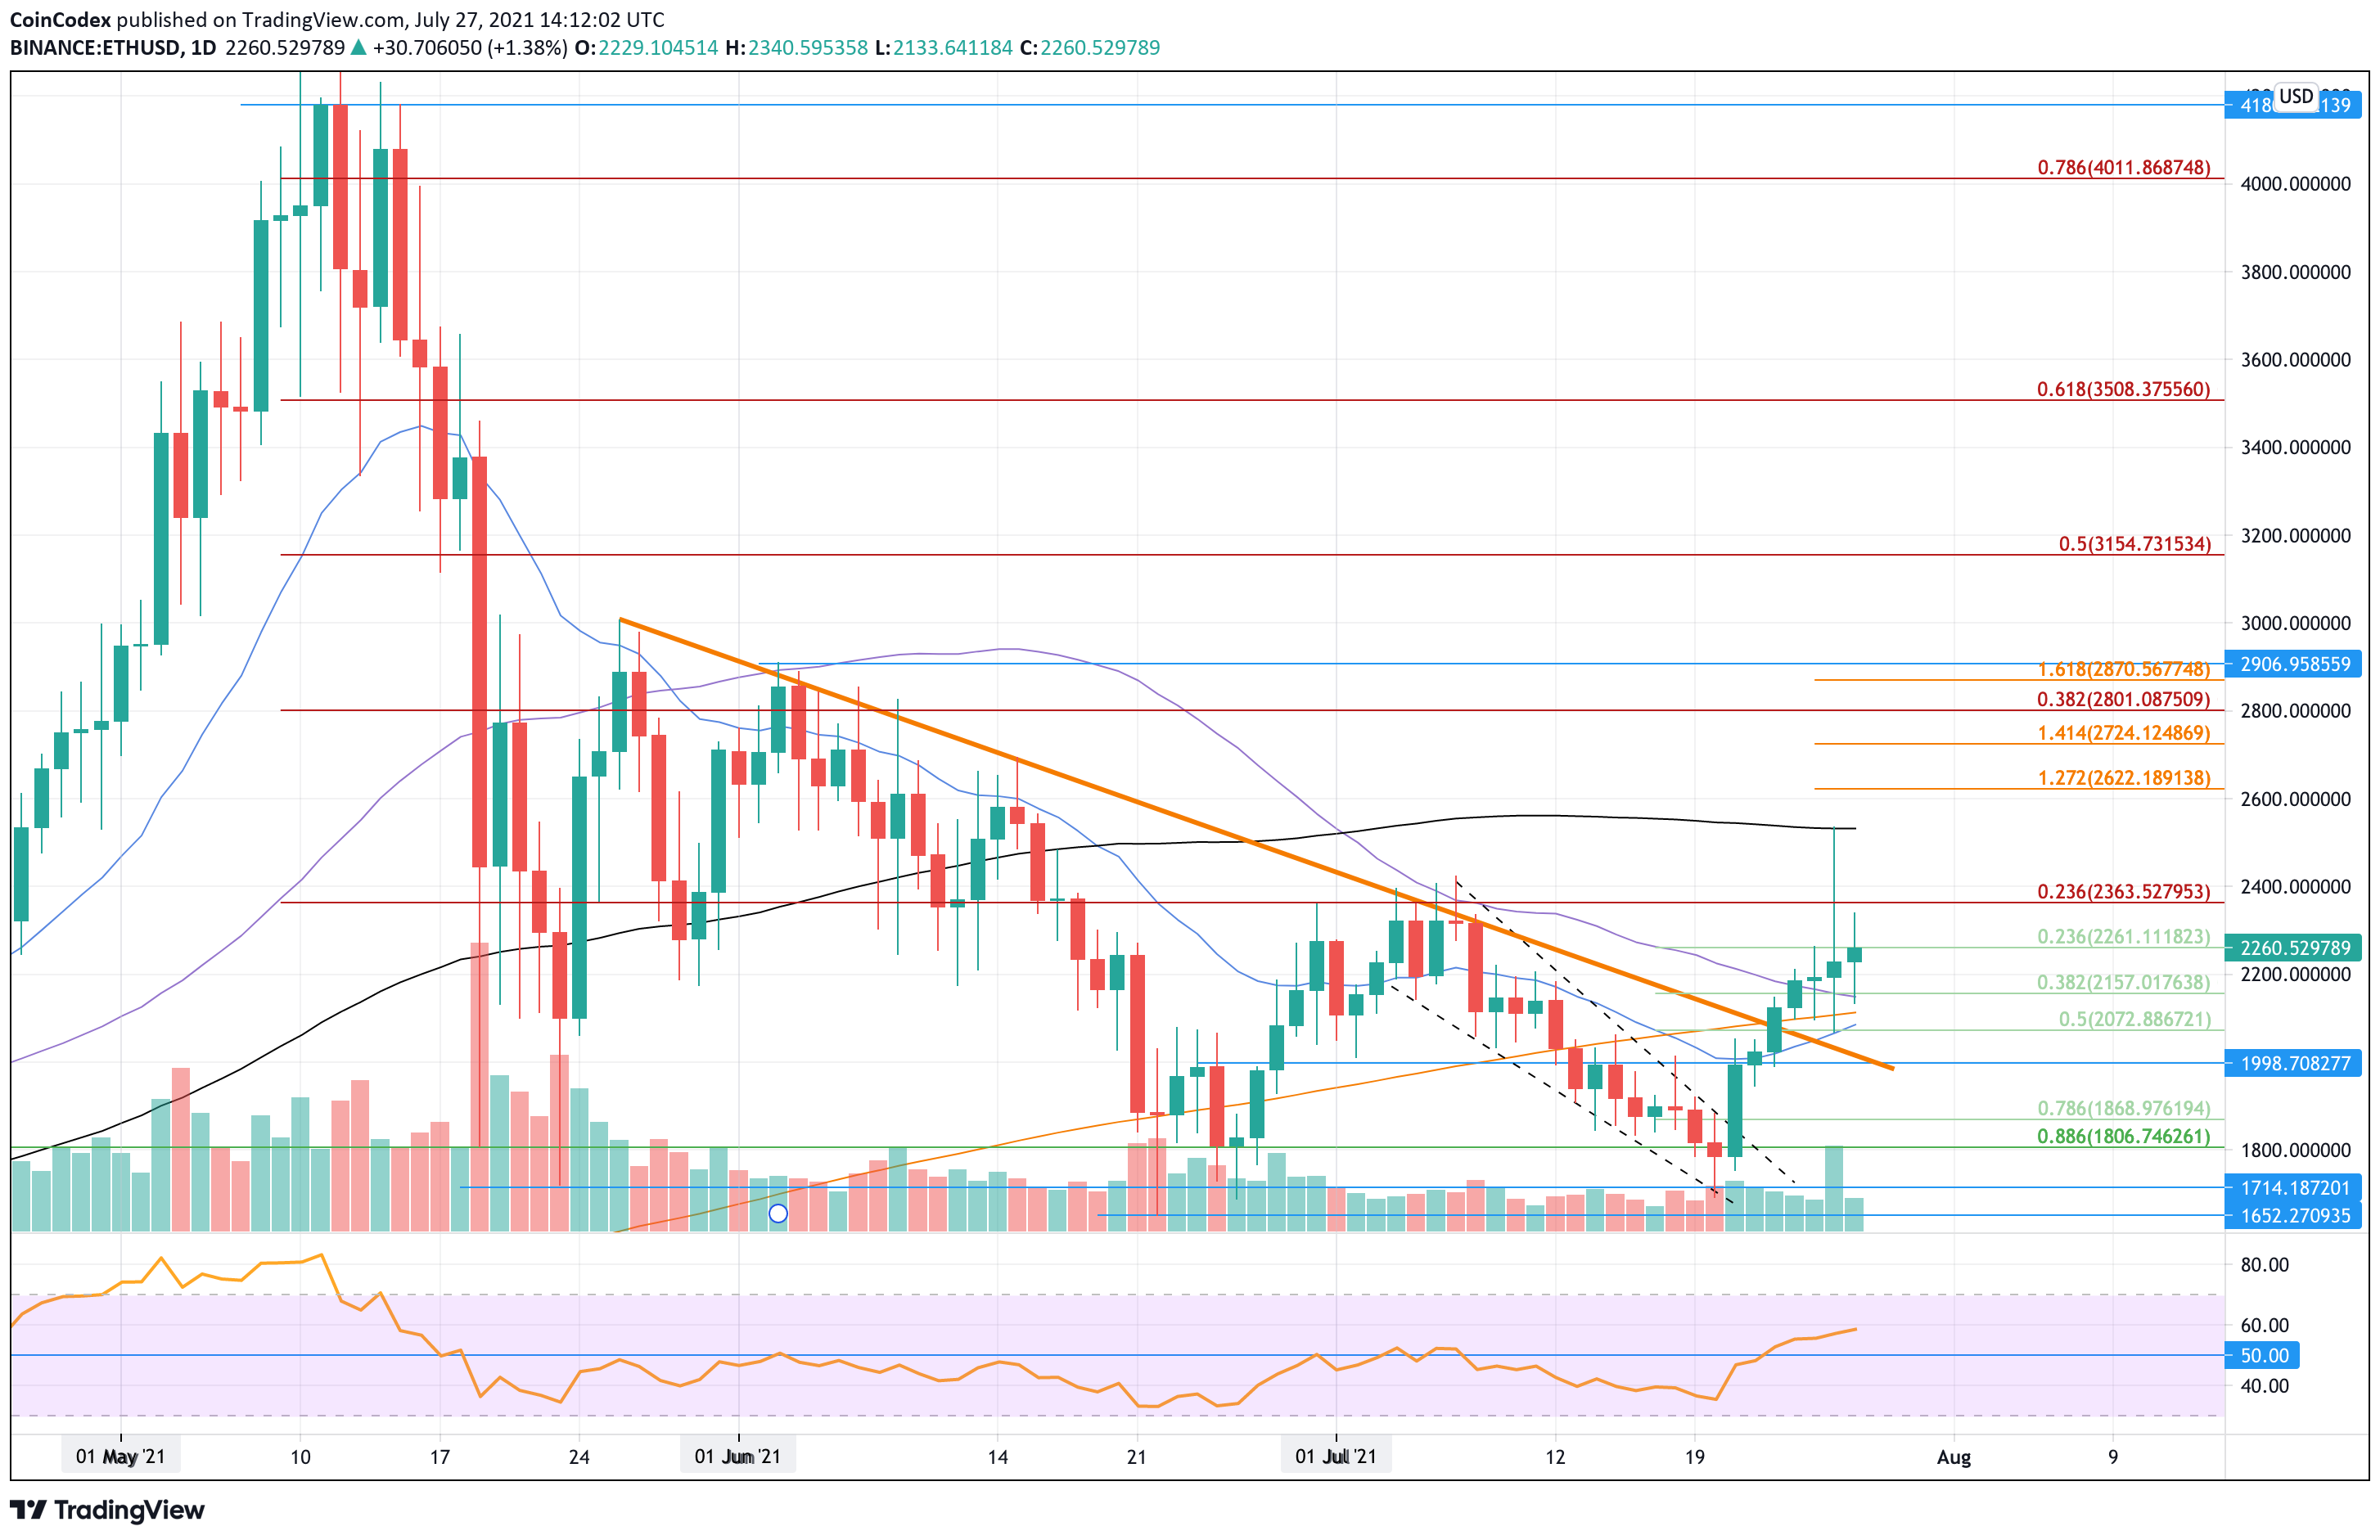
Taking a look at the daily chart for the ETH, we can clearly see ETH breaking the descending wedge last week as it started to surge higher above $2,000. On Friday, ETH broke above the 20-day MA level and also penetrated above the orange falling trend line, signaling the break of a 2-month-old resistance line.
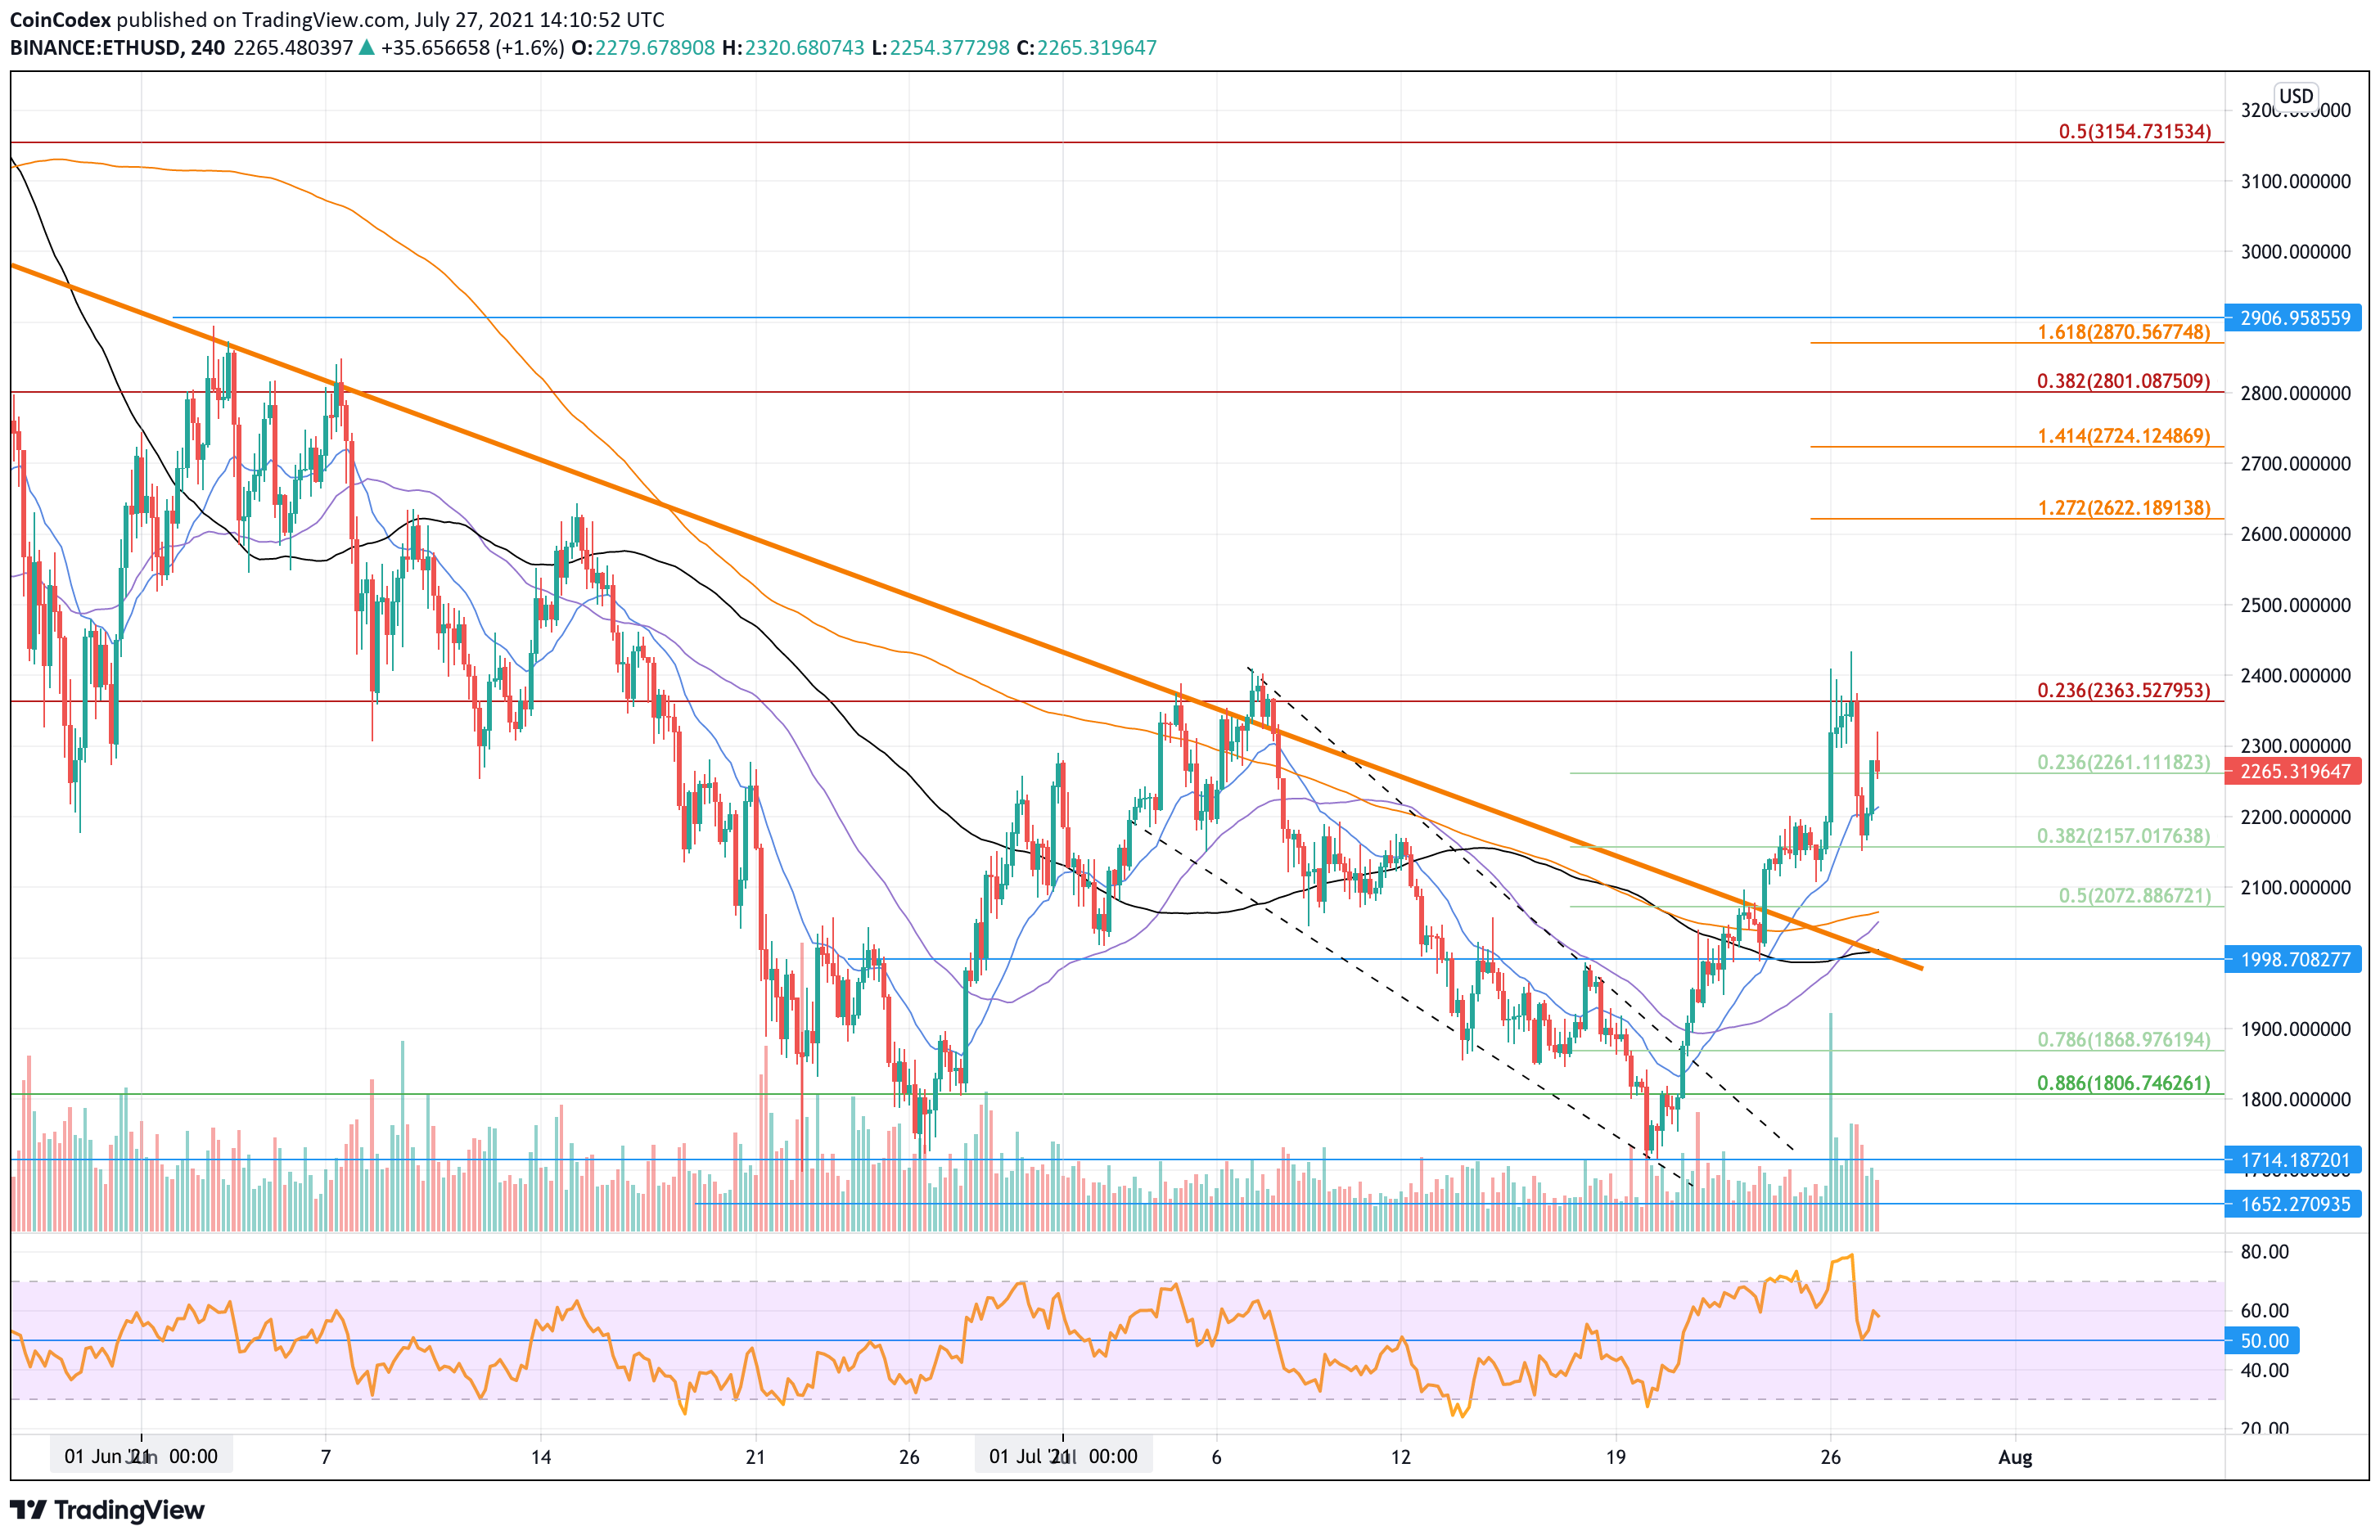
ETH continued to climb above the 50-day MA over the weekend and even spiked as high as the 100-day MA. However, the 4-hour chart shows how the resistance at $2,365 (bearish .236 Fib Retracement) prevented the market from rising further and caused ETH to drop into support at $2,160 (.382 Fib Retracement) today.
It has since bounced back above $2,265.
Ethereum price short-term prediction: Neutral
ETH is neutral until it can break the $2,365 resistance and produce a daily closing candle above it. On the other side, ETH would need to drop beneath $1,800 again now to turn bearish in the short term.
If the sellers push lower, the first support lies at $2,157, provided by the 50-day MA and a .382 Fib Retracement. Beneath this, added support lies at $2,072 (.5 Fib Retracement), $2,000, $1,888, and $1,715.
Where is the resistance toward the upside?
On the other side, the first resistance lies at $2,365 (beraish .236 Fib Retracement). This is followed by resistance at $2,535 (100-day MA), $2,622 (1.272 Fib Extension), $2,725 (1.414 Fib Extension), and $2,800 (bearish .382 Fib Retracement).
Added resistance lies at $2,870, $2,900, and $3,000.
ETH/BTC price analysis
What has been going on?
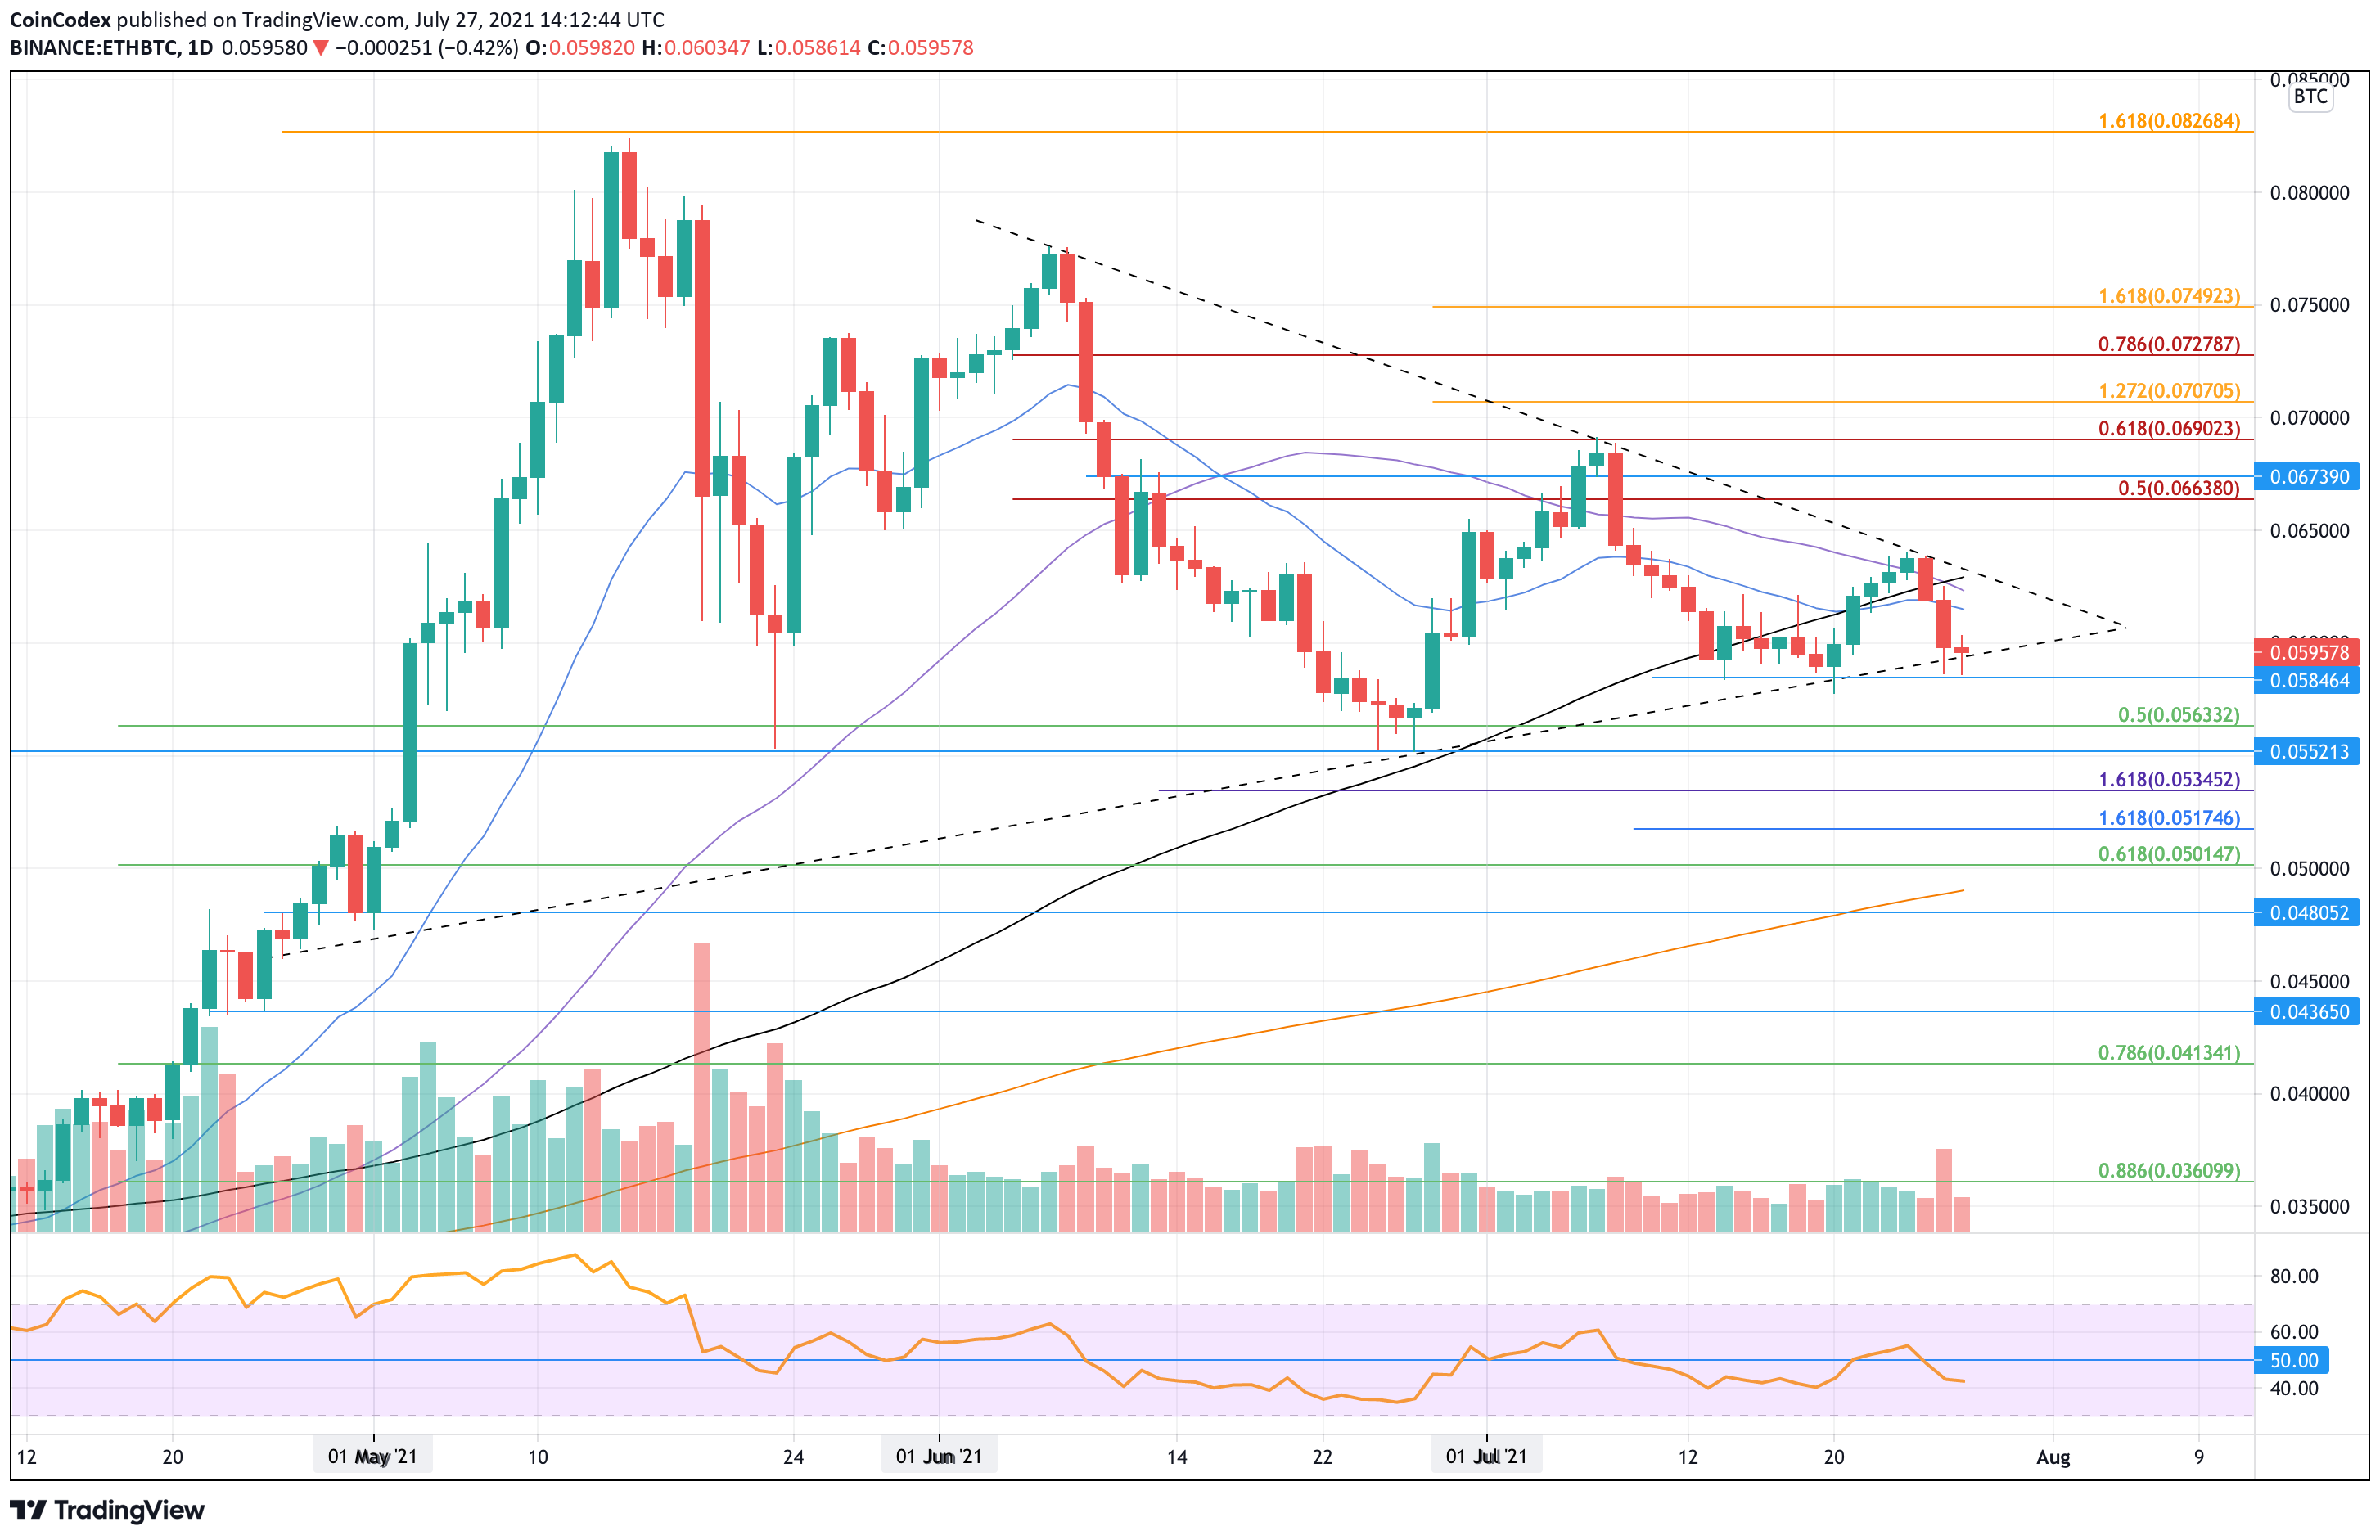
Against BTC, ETH has been trading inside a very wide symmetrical triangle pattern over the past two months. The cryptocurrency was trading at the upper angle of the triangle over the weekend but was unable to overcome the upper boundary.
As a result, ETH dropped lower until support was found at the lower angle of the triangle, where the market currently sits.
The market is quickly approaching the apex of the triangle and a breakout can be expected pretty soon in either direction. With the upcoming London hard fork, it is likely an upside breakout should occur.
Ethereum price short-term prediction: Neutral
As ETH sits inside a symmetrical triangle, it is considered neutral. The coin would need to break the triangle and push above the July resistance at 0.069 BTC to turn bullish. On the other side, a break beneath ₿0.0552 (June lows) would turn the market bearish.
If the sellers push beneath the triangle, the first support lies at ₿0.0584. This is followed by ₿0.0562 (.5 Fib Retracement) and ₿0.055 (May & June support).
Added support lies at ₿0.0535 (downside 1.618 Fib Extension), ₿0.0517, ₿0.05 (.618 Fib Retracement), and ₿0.049 (100-day MA).
Where is the resistance toward the upside?
On the other side, the first resistance lies at ₿0.064 (upper angle of the triangle). This is followed by ₿0.0664 (bearish .5 Fib Retracement), ₿0.069 (bearish .618 Fib Retracement), and ₿0.0707 (1.272 Fib Extension).
Keep up to date with the latest ETH price predictions here.