Key highlights:
- Bitcoin surged 8% over the weekend as it pushed higher from $33,000 to reach as high as $35,600
- The coin hit resistance at the upper angle of a triangle and headed lower to $34,300
- The bulls are attempting to defend the lower boundary of this triangle
| Bitcoin price | $34,350 |
|---|---|
| Key BTC resistance levels | $35,000, $35,600, $36,000, $36,515, $37,425 |
| Key BTC support levels | $34,180, $33,415, $32,650, $32,000, $31,500 |
*Price at the time of publication
Bitcoin saw another whipsaw-like trading period over the weekend as the cryptocurrency pushed higher from $33,000 and moved higher inside an ascending price channel. It continued to climb until resistance was found at around $36,500, provided by the upper boundary of a symmetrical triangle pattern.
Since hitting the resistance, BTC rolled over and headed lower as the buyers attempt to defend the support at $34,180, provided by a .382 Fib and the lower boundary of the triangle.
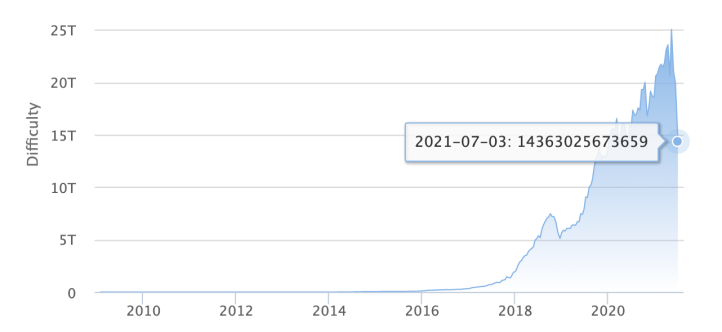
The main topic of discussion last week was largely the incoming Bitcoin mining difficulty adjustment. As a quick recap, China is heavily cracking down on cryptocurrency mining, which has forced many Chinese cryptocurrency miners to close their operations and relocate.
As a result, the hashrate (mining power) for Bitcoin dropped dramatically due to the fact that a large percentage of the hash rate was coming from China. Bitcoin has a mechanism in place to adjust the difficulty of mining (finding a block) to keep in line with the 10 minute block time. If the mining power increases, the difficulty will become higher, making it harder to find blocks. On the other side, if the hash rate drops, so would the difficulty to make it easier to find blocks.
Over the weekend, Bitcoin experienced the biggest downward difficulty adjustment in history. The downward adjustment was around 28%, making it 28% easier to mine Bitcoin making it more profitable for miners.
Interestingly, analyst Willy Woo thinks this could be a very bullish indicator for Bitcoin. In a Tweet this weekend, Woo stated that miner capitulation has historically been a good bottom indicator for Bitcoin:
Today is the political version of “miners capitulation”, selflessly brought to you at much sacrifice by China.
— Willy Woo (@woonomic) July 3, 2021
Miner’s capitulation has historically been a good bottom indicator. https://t.co/UDoFHZh9vz
Woo has been very optimistic during the recent downtrend and still does not believe we are in a bear market. In a recent podcast with Peter McCormack, Woo stated that everything on-chain looks like it’s in recovery. He continued to state that it looks like the typical Wyckoff accumulation pattern and, if it is, the bottom should be around $28K before a push higher.
Wyckoff accumulation is a sideways period that occurs after a prolonged downtrend and is typically an area where large players try to build their positions again after the distribution. It is a phase in the Wycoff method, a five-step method of market analysis for decision making.
Kevin Svenson, the YouTube technical analyst, believes that the worst is over. Overlaying BTC with the Wyckoff distribution puts the phases into perspective:
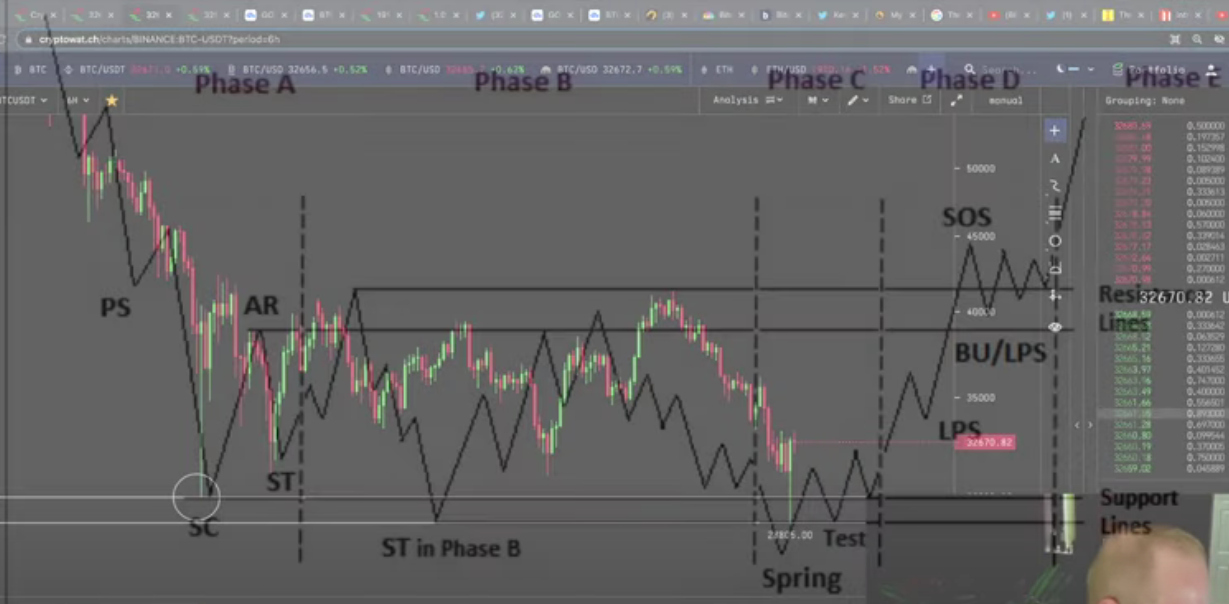
To find out more about this, take a look at his video here.
In other news, the highest accumulation spike for 2021 occurred this weekend, with over 60,000 BTC being purchased. According to Santiment, the majority of this buying came from whale addresses that were holding between 100 to 10,000 BTC:
? #Bitcoin's whale addresses holding between 100 to 10k $BTC kicked off July with a 60k $BTC accumulation apike, the highest daily spike of 2021. These addresses hold 9.12M coins combined after holding 100k less $BTC just 6 weeks ago. https://t.co/RmbojWllGv pic.twitter.com/9Mp65UfGyV
— Santiment (@santimentfeed) July 4, 2021
In addition to this, Willy Woo also pointed out that the Bitcoin user growth is now at all-time highs for 2021:
@glassnode data: "Bitcoin user growth at all time highs for 2021"
— Willy Woo (@woonomic) July 3, 2021
CryptoTwitter traders: "It's definitely a bear market" pic.twitter.com/L7kk6W4PKS
Bitcoin now holds a $640 billion market cap value.
Let us take a quick look at the markets and see where we might be heading.
Bitcoin price analysis
Daily chart
4-hour chart
What has been going on?
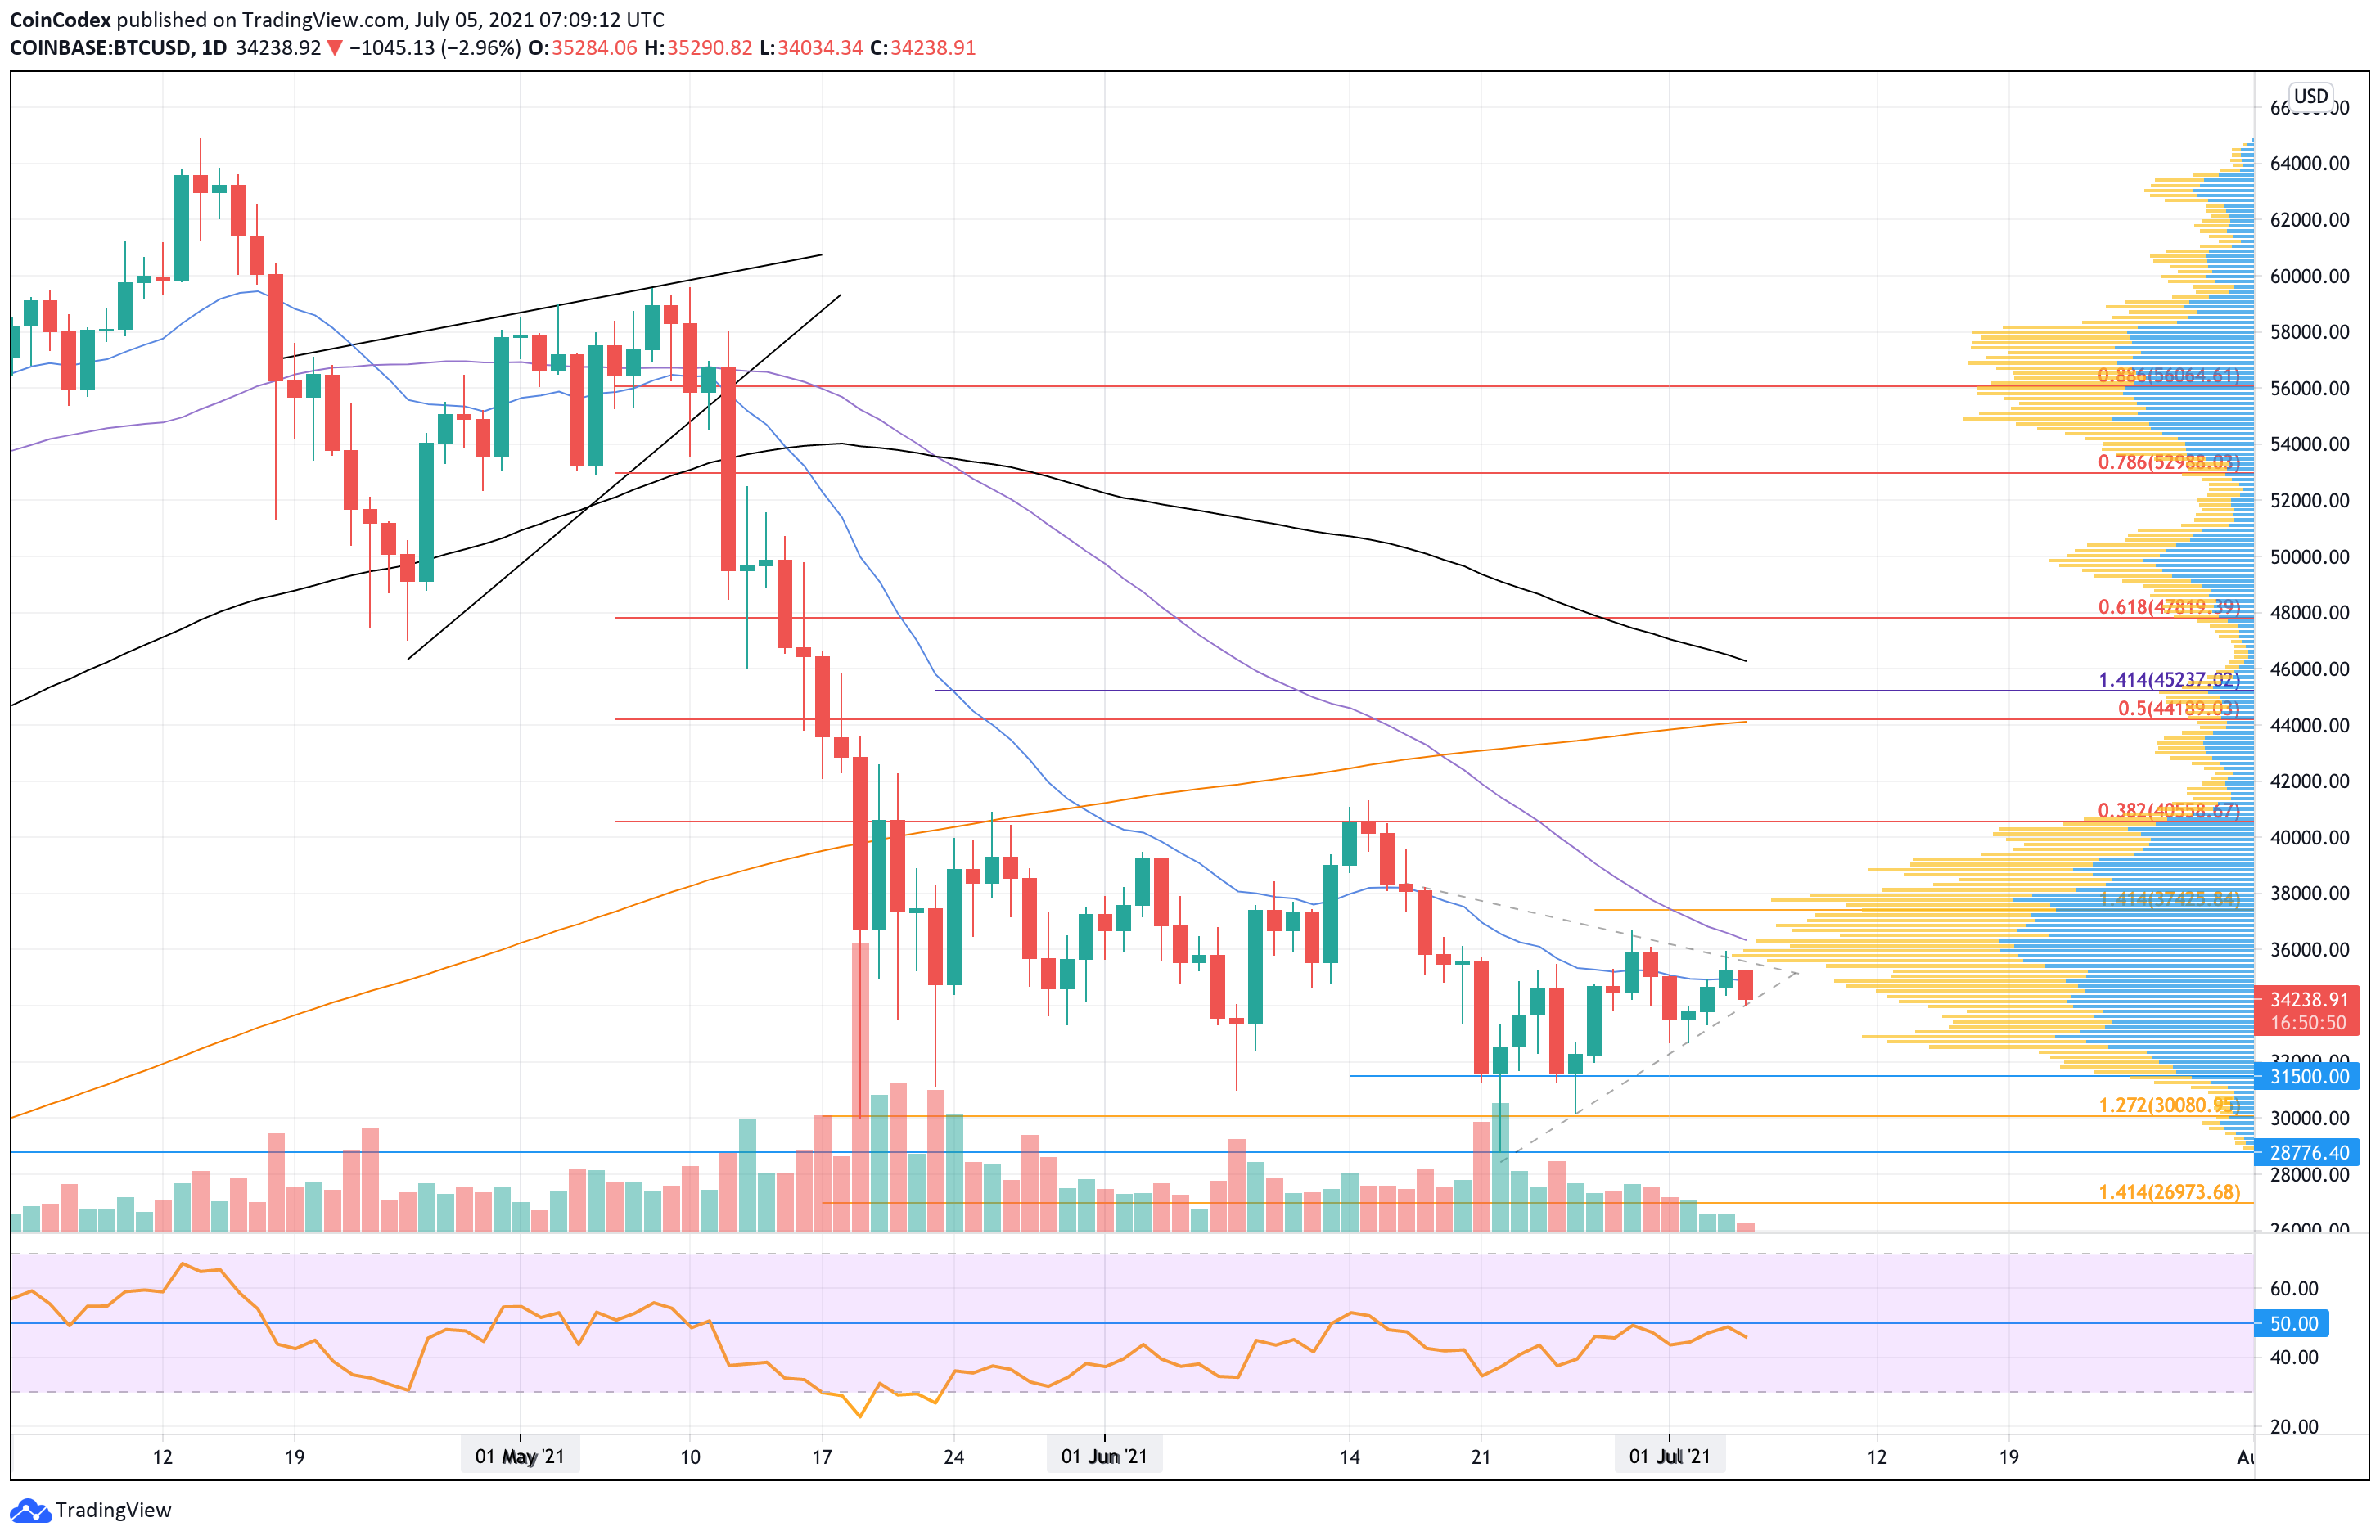
Starting with the daily chart above, it is clear that Bitcoin is trading inside a symmetrical triangle formation. The coin double-bottomed last week and surged higher into the upper boundary of the triangle. It rolled over from there as July started to trade as the market headed into the lower boundary.
BTC is currently approaching the triangle’s apex, where a breakout can be expected in either direction.
The Volume Profile shows that there is quite some resistance between $35,600 and $38,000. BTC would also need to break the mid-May resistance at $42,000 before turning bullish again.
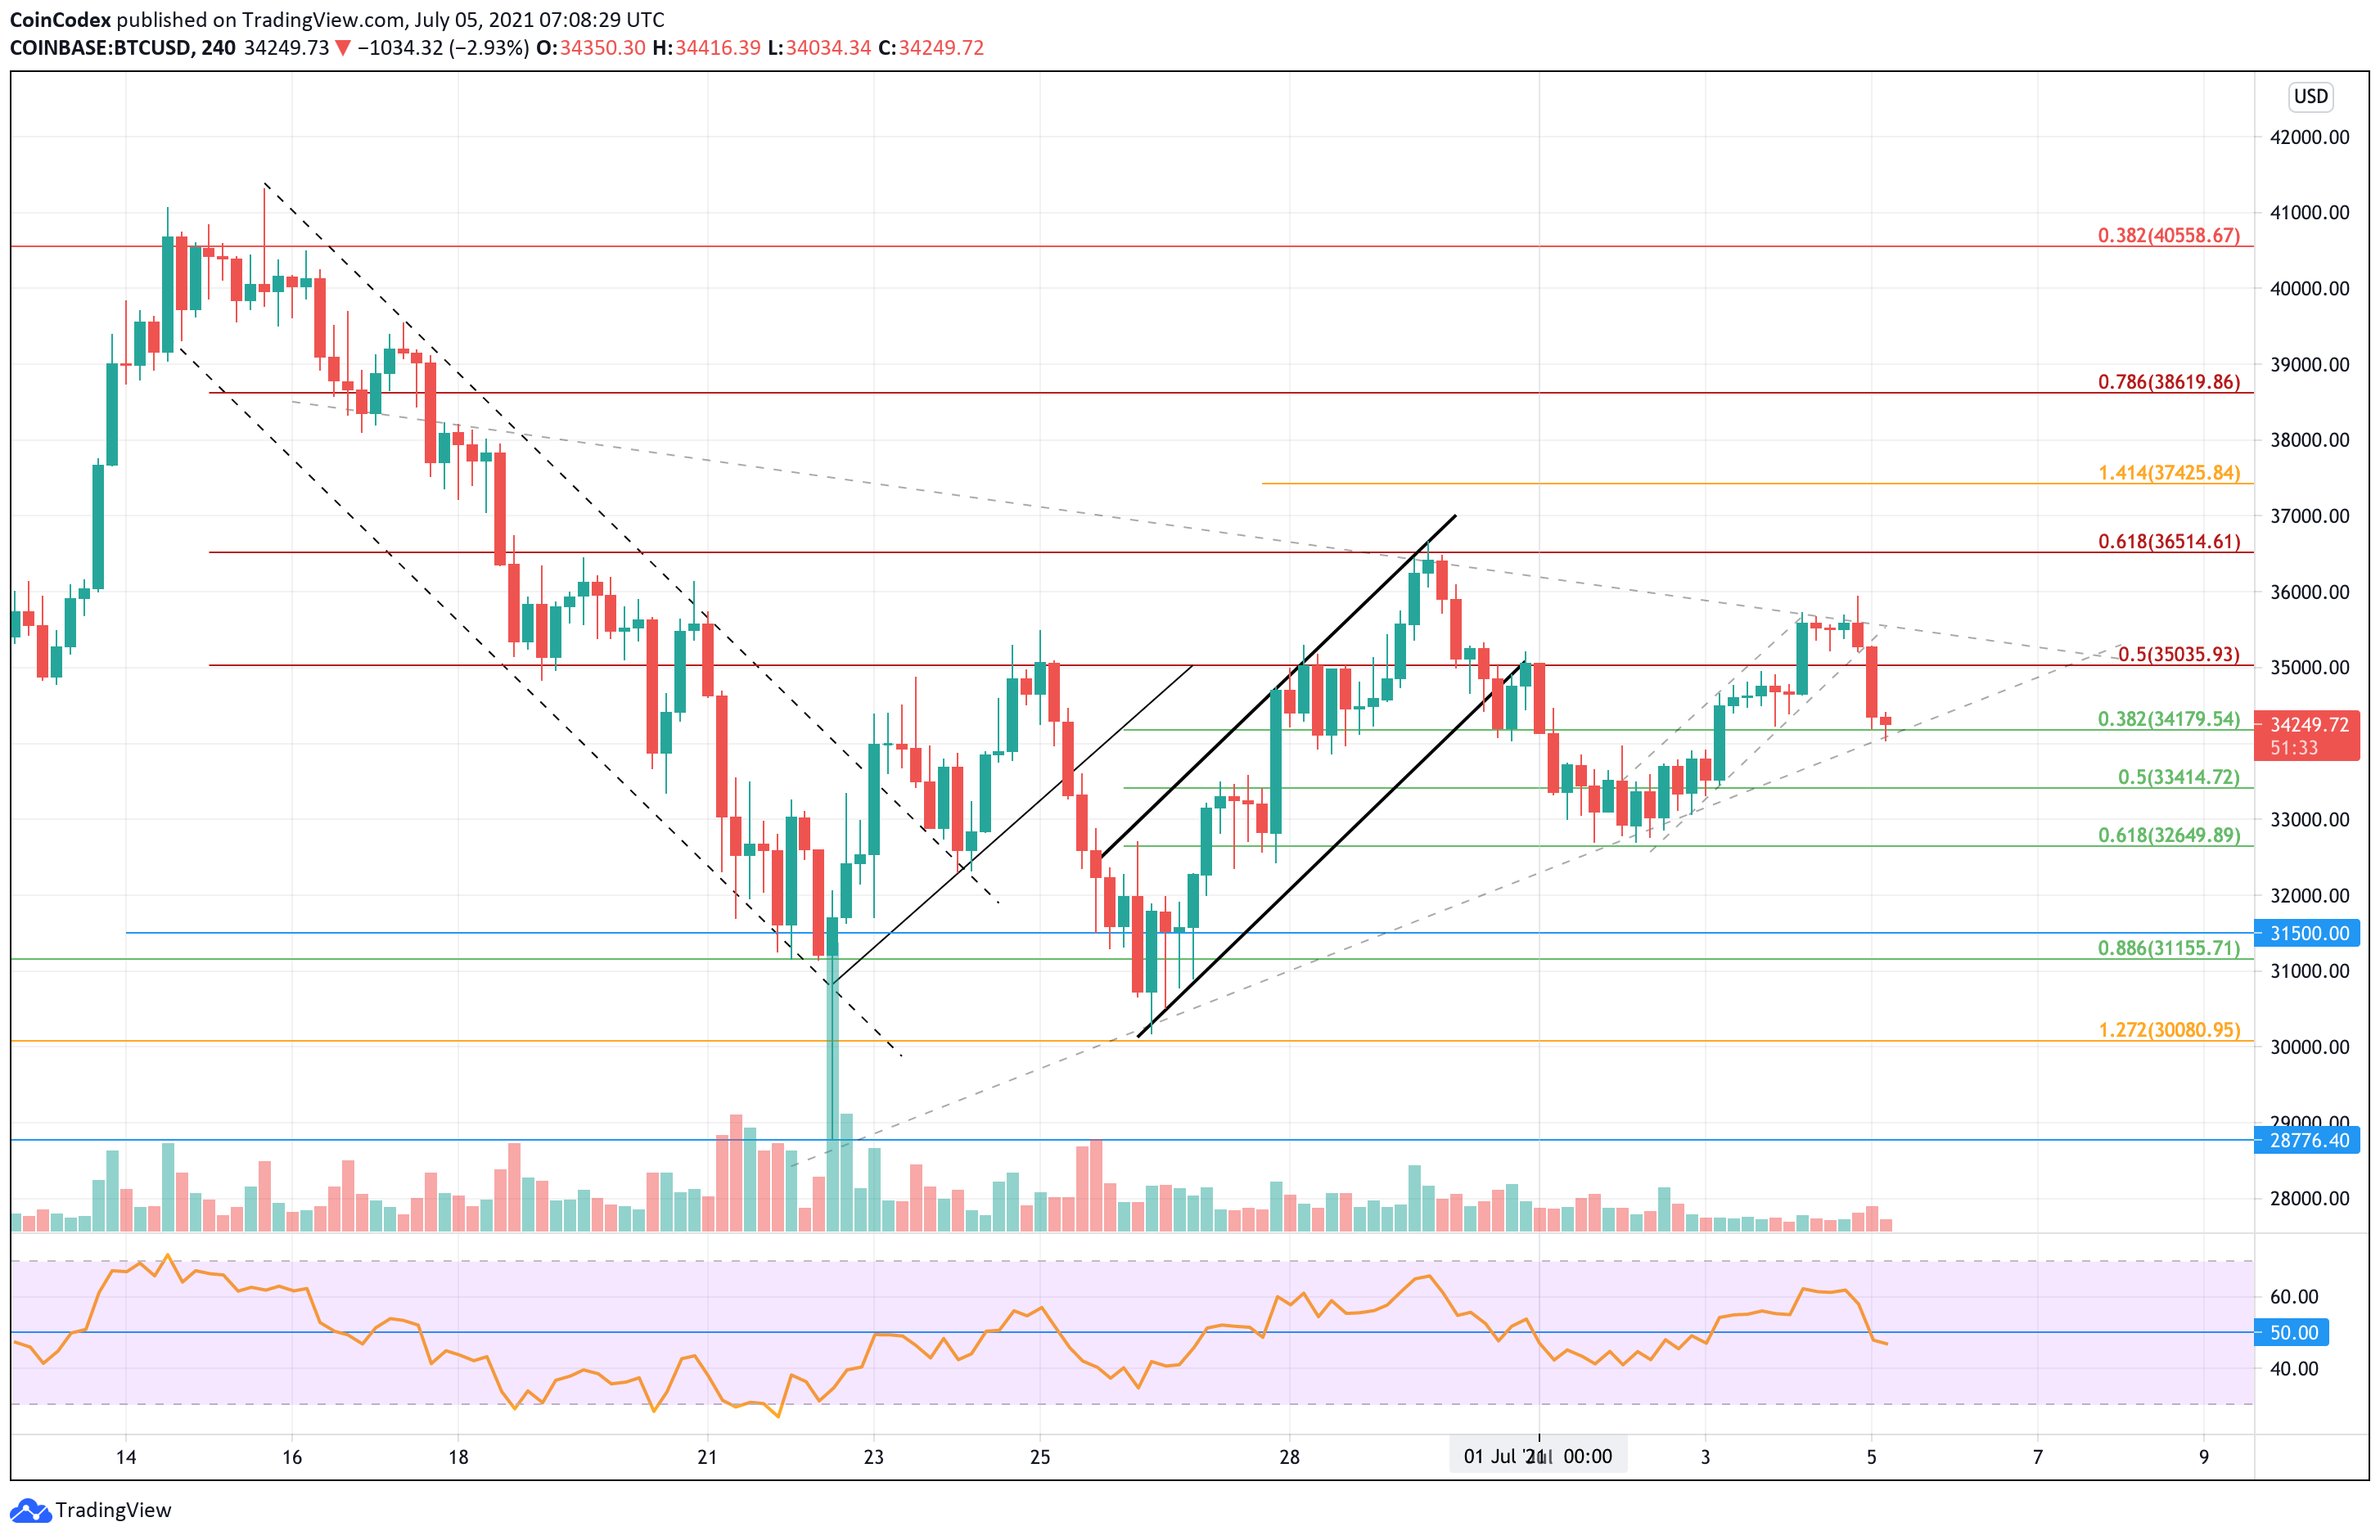
BTC broke the ascending price channel it was trading within last week today on the short-term side of things. It had reached the resistance at the upper angle of the triangle at around $35,600 and rolled over to break beneath the price channel.
BTC is now trading at support provided by the lower angle of the triangle and the .382 Fib Retracement at around $34,180.
Bitcoin price short-term prediction: Neutral
Bitcoin still remains neutral in the short term and would have to break above resistance at $42,000 to start to turn bullish again. On the other side, a daily closing candle beneath $30,000 would be required to turn the market bearish.
Looking ahead, if the sellers push beneath the support at the lower angle of the triangle, the first support lies at $33,415 (.5 Fib Retracement). This is followed by support at $33,000, $32,650 (.618 Fib Retracement), $32,000, and $31,500. Added support lies at $31,155 (long term .886 Fib Retracement), $30,600, and $30,000.
Where is the resistance toward the upside?
On the other side, the first resistance lies at $35,000 (bearish .5 Fib Retracement). This is followed by the upper angle of the triangle, $35,600 (weekend resistance), $36,000, and $35,515 (bearish .618 Fib Retracement).
If the buyers continue to break $37,000, resistance is located at $37,425 (1.414 Fib Extension), $38,000, and $38,620 (bearish .786 Fib Retracement).
Added resistance lies at $39,000 and $40,000.
Keep up-to-date with the latest Bitcoin price predictions here.